


Overview
Why Invest in AIVC ETF?
- Targeted AI Value Chain Exposure: AIVC offers direct exposure to a cross-section of companies that are the backbone of the AI revolution including cloud computing, semiconductors and hardware.
- Expansive AI Growth Opportunity: The global AI market size is expected to grow from $757 billion in 2025 to a staggering $4.2 trillion by 2035 driven by rising spending in the public sector, governments, and by individuals.1
- Powered by Bloomberg Intelligence (BI) Research: Leveraging 400+ research professionals across 21 markets, the BI team utilizes proprietary research to evaluate data and trends for creating thematic index baskets.
Objective & Strategy
The Amplify Bloomberg AI Equal Weight ETF (AIVC) seeks investment results that generally correlate (before fees and expenses) to the total return performance of the Bloomberg AI Value Chain Equal Weight Total Return Index. In an equal-weighted index approach, AIVC invests in a global mix of semiconductor, cloud/software and hardware companies that form the foundation of artificial intelligence (AI) technologies.
Key Information
Fund Details
| Ticker | AIVC |
| Launch Date | 03/08/2016 |
| Primary Exchange | NYSE Arca |
| CUSIP | 032108573 |
| Net Assets | $139,959,978 |
| Shares Outstanding | 1,200,000 |
| Holdings (view all holdings) | 48 |
| Total Expense Ratio i | 0.59% |
Index Details
| Index Name | Bloomberg AI Value Chain Equal Weight Total Return Index |
| Index Ticker | BAIVT |
| Index Provider | Bloomberg Index Services Limited |
| Weighting Methodology | Equal Weight |
| Rebalance Frequency | Quarterly |
| Index Website | Bloomberg.com |
Performance & Holdings
Performance
| Cumulative (%) | Annualized (%) | |||||||||
|---|---|---|---|---|---|---|---|---|---|---|
| 1MO | 3MO | 6MO | YTD | Since Inception | 1YR | 3YR | 5YR | 10YR | Since Inception | |
| NAV | 8.30% | -2.18% | 53.57% | 64.70% | 365.97% | 96.61% | 45.25% | 15.95% | 15.45% | 15.81% |
| Closing Price | 8.55% | -2.25% | 54.19% | 64.78% | 366.05% | 96.65% | 45.38% | 15.98% | 15.37% | 15.82% |
| Bloomberg AI Value Chain Equal Weight Total Return Index | 8.42% | -2.13% | 54.38% | 65.84% | — | 98.61% | 46.86% | — | — | — |
| Cumulative (%) | Annualized (%) | |||||||||
|---|---|---|---|---|---|---|---|---|---|---|
| 1MO | 3MO | 6MO | YTD | Since Inception | 1YR | 3YR | 5YR | 10YR | Since Inception | |
| NAV | 0.71% | 68.63% | 69.57% | 69.57% | 379.76% | 115.49% | 48.15% | 17.34% | 17.04% | 16.42% |
| Closing Price | 0.94% | 67.15% | 70.14% | 70.14% | 381.24% | 116.44% | 48.20% | 17.39% | 17.00% | 16.46% |
| Bloomberg AI Value Chain Equal Weight Total Return Index | 0.64% | 69.24% | 70.52% | 70.52% | 0.00% | 117.89% | 50.24% | 0.00% | 0.00% | — |
The performance data quoted represents past performance and does not guarantee future results. Investment return and principal value of an investment will fluctuate so that an investor’s shares, when sold or redeemed, may be worth more or less than the original cost. Current performance may be lower or higher than the performance quoted. Brokerage commissions will reduce returns. NAV is the sum of all its assets less any liabilities, divided by the number of shares outstanding. The closing price is the last price at which the fund traded.
Indexes are unmanaged and it’s not possible to invest directly in an index. The Bloomberg AI Value Chain Equal Weight Total Return Index is designed to track the performance of Al hardware, semiconductors, and cloud computing companies.
Extraordinary performance is attributable in part to unusually favorable market conditions and may not be repeated or consistently achieved in the future.
Top 10 Holdings
| Name | Ticker | Market Value (%) | CUSIP | Shares | Market Value ($) |
|---|---|---|---|---|---|
| Atlassian Corp | TEAM | 4.62% | 049468101 | 34,248 | $6,460,885 |
| Hewlett Packard Enterprise Co | HPE | 3.04% | 42824C109 | 69,638 | $4,250,007 |
| Dell Technologies Inc | DELL | 2.86% | 24703L202 | 7,282 | $3,997,235 |
| Lumentum Holdings Inc | LITE | 2.66% | 55024U109 | 3,942 | $3,727,831 |
| Snowflake Inc | SNOW | 2.65% | 833445109 | 11,037 | $3,714,944 |
| Arista Networks Inc | ANET | 2.63% | 040413205 | 17,947 | $3,682,545 |
| Microsoft Corp | MSFT | 2.62% | 594918104 | 7,353 | $3,661,794 |
| Alibaba Group Holding Ltd | 9988 HK | 2.50% | BK6YZP5 | 239,300 | $3,502,517 |
| MongoDB Inc | MDB | 2.47% | 60937P106 | 8,092 | $3,460,867 |
| Advanced Micro Devices Inc | AMD | 2.47% | 007903107 | 5,546 | $3,459,428 |
Fund holdings are subject to change at any time and should not be considered recommendations to buy or sell any security.
Allocation
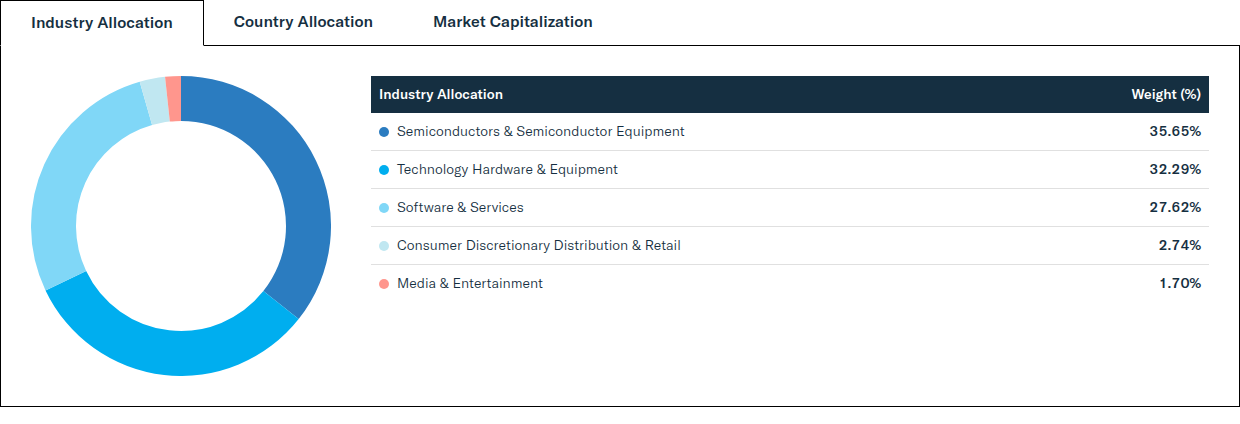
| Industry Allocation | Weight (%) |
|---|---|
| Semiconductors & Semiconductor Equipment | 35.65% |
| Technology Hardware & Equipment | 32.29% |
| Software & Services | 27.62% |
| Consumer Discretionary Distribution & Retail | 2.74% |
| Media & Entertainment | 1.70% |
| Market Capitalization | Weight (%) |
|---|---|
| Large Capitalization (> $10B) | 96.54% |
| Mid Capitalization ($2B - $10B) | 3.46% |
| Small Capitalization ($300M - < $2B) | 0.00% |
| Country Allocation | Weight (%) |
|---|---|
| United States | 69.09% |
| Taiwan | 9.33% |
| Korea | 6.58% |
| Netherlands | 5.35% |
| China | 3.17% |
| Japan | 2.07% |
| Canada | 1.65% |
| Australia | 1.65% |
| Hong Kong | 1.11% |
Distributions
| Ex-Date | Record Date | Payable Date | Amount (USD) |
|---|---|---|---|
| 12/30/2026 | 12/30/2026 | 12/31/2026 | — |
There is no guarantee that distributions will be made.
Price
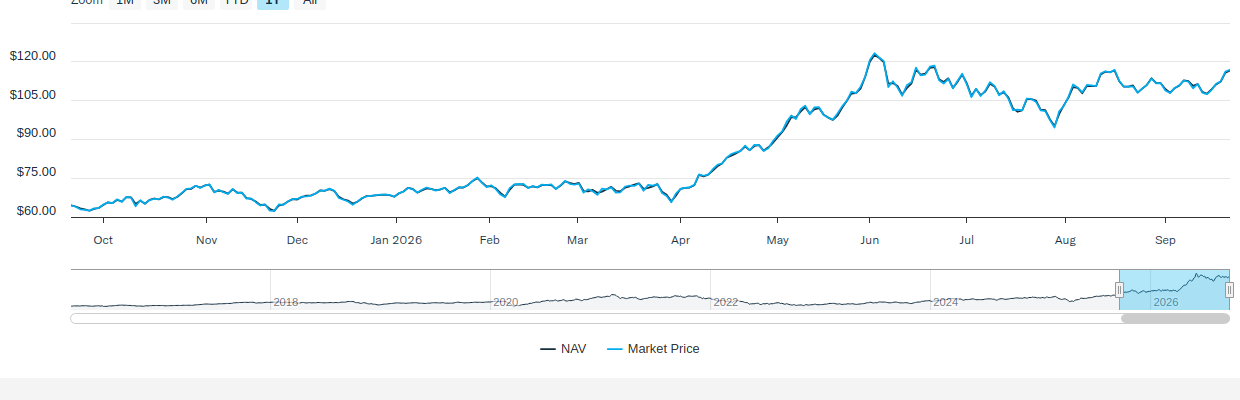
NAV/Market Price
| Previous Day's NAV | |
|---|---|
| Net Asset Value: | $116.63 |
| Daily Change: | $0.85 |
| % Daily Change: | 0.73% |
| 30-Day Median Bid/Ask Spread: | 0.30% |
| Previous Day's Market Price | |
|---|---|
| Closing Price: | $116.95 |
| Daily Change: | $0.72 |
| % Daily Change: | 0.62% |
| % Premium/Discount: | 0.27% |
Daily Price/NAV Performance
Premium/Discount
| 2025 | Q1 2026 | Q2 2026 | Q3 2026 | Q4 2026 | |
|---|---|---|---|---|---|
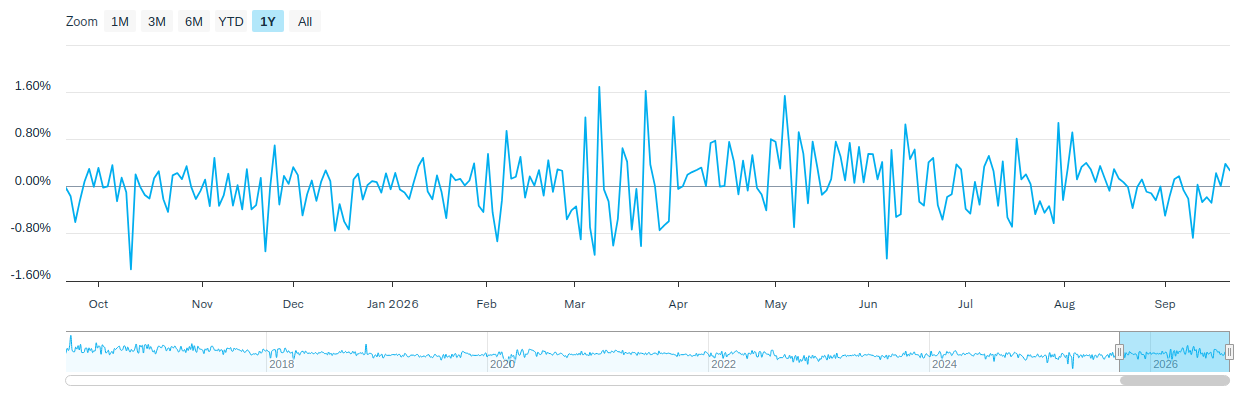
| Days Traded at Premium | 64 | 30 | 42 | - | - |
| Days Traded at NAV | 0 | 0 | 0 | - | - |
| Days Traded at Discount | 187 | 31 | 20 | - | - |
The table and line graph are provided to show the frequency at which the closing price of the Fund was at a premium (above) or discount (below) to the Fund’s daily net asset value (“NAV”). The table and line graph represent past performance and cannot be used to predict future results. Shareholders may pay more than NAV when buying Fund shares and receive less than an NAV when those shares are sold because shares are bought and sold at current market prices.
Literature
Fund Resources
Insights
Why Top 10 ETFs? Small Group. Big Impact. ETF Watch
September 22, 2026
Focused exposure to leading companies across quantum computing, space, robotics, and Asia memory semiconductors.
A Primer on Understanding Stablecoins
September 18, 2026
The Bridge Between Crypto and Your Wallet
International Insights: Investing Across the Globe - August 2026
September 17, 2026
Audio Commentary by Tim Seymour, IDVO Portfolio Manager
How to Invest
Amplify ETFs trade throughout the day, similar to publicly-traded stocks, on an exchange. There are multiple ways to invest in Amplify ETFs:
- Contact a Financial Advisor to discover how Amplify ETFs may fit within your portfolio.
- Amplify ETFs are available through various online platforms and brokerage accounts.
Connect with your ETF Specialist or call (855) 267-3837
Amplify Bloomberg AI Value Chain ETF and Bloomberg AI Value Chain Index renamed on/about 5/28/26.
1precedenceresearch.com/artificial-intelligence-market
Investing involves risk, including the possible loss of principal. There can be no assurance that the Fund’s investment objectives will be achieved. Investments concentrated in specific industries, sectors, markets, or asset classes may underperform or experience greater volatility than the general securities market.
Investments in artificial intelligence or cloud technology companies are exposed to risks such as small markets, technological obsolescence, and government regulation. These companies, especially smaller ones, are more volatile and susceptible to adverse events in specific regions or industries.
International investing entails risks related to foreign currency, limited liquidity, less government regulation, and potential volatility from political, economic, or other developments, particularly in emerging markets and concentrated investments in single countries.
Investment Adviser: Amplify Investments LLC; Sub-Adviser: Penserra Capital Management LLC.