
Overview
Why Invest in USNG ETF?
- Surging Natural Gas Demand: Fueled by the digital economy’s need for ample power at competitive costs, U.S. natural gas demand is projected to increase up to 20% by 2030.1
- Supplying the Export Growth: The U.S., the world’s leading exporter of liquefied natural gas (LNG), is poised for exports to double by 2030—fueled by global market shifts and escalating demand for American energy.2
- Infrastructure Policy Tailwinds: National energy policies and corporate strategies are accelerating major natural gas infrastructure projects to tackle the national energy emergency.
Objective & Strategy
The Amplify Samsung U.S. Natural Gas Infrastructure ETF (USNG) seeks long-term capital appreciation by investing primarily in assets of U.S.-listed equity securities of natural gas companies. USNG is actively managed using the GARP (growth at a reasonable price) method to select companies believed to benefit from the U.S. natural gas infrastructure ecosystem across upstream, midstream, and downstream segments.
Key Information
Fund Details
| Ticker | USNG |
| Launch Date | 05/20/2025 |
| Primary Exchange | NYSE Arca |
| CUSIP | 032108441 |
| Net Assets | $7,085,073 |
| Shares Outstanding | 200,000 |
| Holdings (view all holdings) | 26 |
| Total Expense Ratio i | 0.59% |
Portfolio Management
Selection Methodology
Starting Universe
U.S. listed companies in the Energy, Utilities and Materials sectors
Identify
Companies within U.S. natural gas value chain segments:
- Midstream
- Upstream
- Downstream
Approach
Use a GARP process to identify the most attractive U.S. Natural Gas Infrastructure companies based on their earnings, cash flow, and dividend growth potential
Final Portfolio
Approx. 20-25 companies
Performance & Holdings
Performance
| Cumulative (%) | Annualized (%) | |||||||||
|---|---|---|---|---|---|---|---|---|---|---|
| 1MO | 3MO | 6MO | YTD | Since Inception | 1YR | 3YR | 5YR | 10YR | Since Inception | |
| NAV | 4.44% | 10.79% | 34.79% | 34.79% | 49.70% | 42.46% | — | — | — | 43.59% |
| Closing Price | 4.50% | 10.99% | 34.71% | 34.71% | 49.70% | 42.44% | — | — | — | 43.60% |
| S&P 500 TR | -0.95% | 15.20% | 10.21% | 10.21% | 27.47% | 22.32% | — | — | — | 24.32% |
The performance data quoted represents past performance and does not guarantee future results. Investment return and principal value of an investment will fluctuate so that an investor’s shares, when sold or redeemed, may be worth more or less than the original cost. Current performance may be lower or higher than the performance quoted. Brokerage commissions will reduce returns. NAV is the sum of all its assets less any liabilities, divided by the number of shares outstanding. The closing price is the last price at which the fund traded.
Extraordinary performance is attributable in part to unusually favorable market conditions and may not be repeated or consistently achieved in the future.
Top 10 Holdings
| Name | Ticker | Market Value (%) | CUSIP | Shares | Market Value ($) |
|---|---|---|---|---|---|
| Solaris Energy Infrastructure Inc | SEI | 9.65% | 83418M103 | 10,180 | $683,994 |
| Bloom Energy Corp | BE | 8.64% | 093712107 | 2,260 | $612,211 |
| Williams Cos Inc/The | WMB | 8.28% | 969457100 | 8,020 | $586,583 |
| Kinder Morgan Inc | KMI | 7.24% | 49456B101 | 16,000 | $512,960 |
| MPLX LP | MPLX | 6.95% | 55336V100 | 8,620 | $492,719 |
| Enbridge Inc | ENB | 6.79% | 29250N105 | 8,900 | $481,312 |
| TC Energy Corp | TRP | 4.17% | 87807B107 | 4,440 | $295,127 |
| DT Midstream Inc | DTM | 4.08% | 23345M107 | 2,000 | $289,180 |
| Plains GP Holdings LP | PAGP | 4.02% | 72651A207 | 11,660 | $284,854 |
| Archrock Inc | AROC | 3.76% | 03957W106 | 7,240 | $266,360 |
Fund holdings are subject to change at any time and should not be considered recommendations to buy or sell any security.
Allocation

Distributions
| Ex-Date | Record Date | Payable Date | Amount (USD) |
|---|---|---|---|
| 03/30/2026 | 03/30/2026 | 03/31/2026 | $0.10419 |
| 06/29/2026 | 06/29/2026 | 06/30/2026 | $0.12011 |
| 09/29/2026 | 09/29/2026 | 09/30/2026 | — |
| 12/30/2026 | 12/30/2026 | 12/31/2026 | — |
There is no guarantee that distributions will be made.
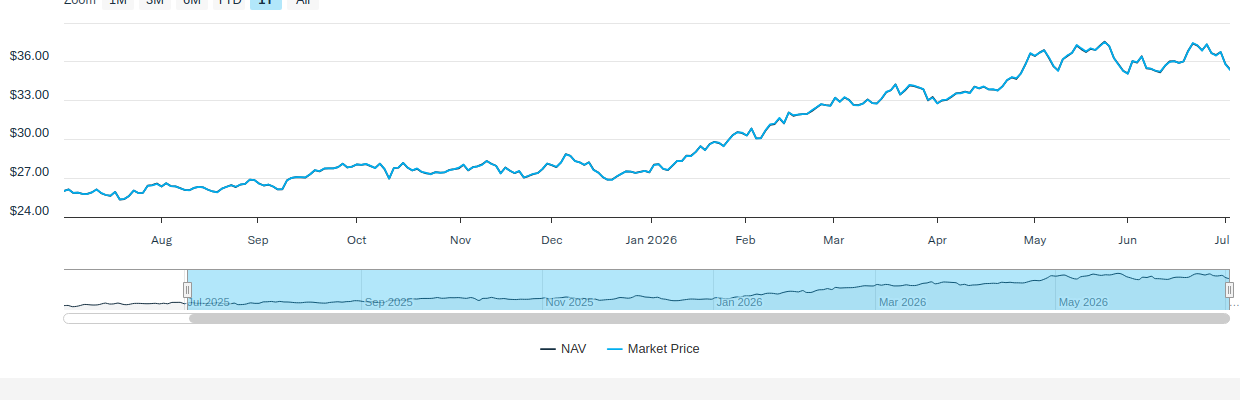
Price
NAV/Market Price
| Previous Day's NAV | |
|---|---|
| Net Asset Value: | $35.43 |
| Daily Change: | $-0.42 |
| % Daily Change: | -1.17% |
| 30-Day Median Bid/Ask Spread: | 0.19% |
| Previous Day's Market Price | |
|---|---|
| Closing Price: | $35.37 |
| Daily Change: | $-0.46 |
| % Daily Change: | -1.27% |
| % Premium/Discount: | -0.16% |
Daily Price/NAV Performance
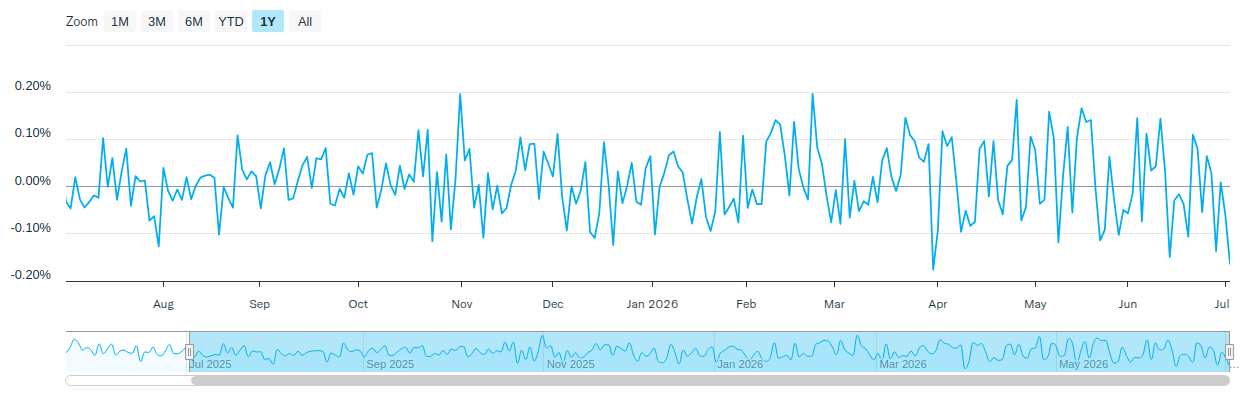
Premium/Discount
| 2025 | Q1 2026 | Q2 2026 | Q3 2026 | Q4 2026 | |
|---|---|---|---|---|---|
| Days Traded at Premium | 92 | 31 | 32 | - | - |
| Days Traded at NAV | 1 | 0 | 0 | - | - |
| Days Traded at Discount | 64 | 30 | 30 | - | - |
The table and line graph are provided to show the frequency at which the closing price of the Fund was at a premium (above) or discount (below) to the Fund’s daily net asset value (“NAV”). The table and line graph represent past performance and cannot be used to predict future results. Shareholders may pay more than NAV when buying Fund shares and receive less than an NAV when those shares are sold because shares are bought and sold at current market prices.
Literature
Fund Resources
Insights
International Insights: Investing Across the Globe - May 2026
June 8, 2026
Audio Commentary by Tim Seymour, IDVO Portfolio Manager
Climate Capital: The Case for ESG Investing
May 22, 2026
In an era where climate change debates heat the political sphere, many savvy business owners and investors are turning their focus toward a cooler, more sustainable future.
The Digital Economy Is Built on Real Assets
May 20, 2026
Artificial intelligence and the digital economy are driving unprecedented demand for electricity and critical materials—creating a new energy supercycle.
How to Invest
Amplify ETFs trade throughout the day, similar to publicly-traded stocks, on an exchange. There are multiple ways to invest in Amplify ETFs:
- Contact a Financial Advisor to discover how Amplify ETFs may fit within your portfolio.
- Amplify ETFs are available through various online platforms and brokerage accounts.
Connect with your ETF Specialst or call (855) 267-3837
1AI Data Centers Boost Domestic Natural Gas Demand | Bloomberg | September 22, 2025
2U.S. Liquefied Natural Gas (LNG) Exports Fact Sheet | U.S. Department of Energy | March 2025.
3Schedule K-1 is a federal tax document used to report the income, losses, and dividends of a business’ or financial entity’s partners or an S corporation’s shareholders. This information does not constitute, and should not be considered a substitute for, legal or tax advice.
Investing involves risk including the possible loss of principal. You could lose money by investing in the Fund. As an actively managed fund, there is no guarantee the investment objective will be met. Being new, the fund has a limited operating history to evaluate. As a non-diversified fund, its performance and Share price are more prone to volatility from individual investments.
Investments in energy companies can be influenced by cyclical markets, price fluctuations, regulation, economic shifts, technology, and geopolitical instability. Risks for natural gas companies include alternative fuels, price volatility, interest rates, and developments like renewable energy growth and evolving regulations. Utilities companies include risks related to financing, environmental costs, market factors, and political influences.
Materials companies are impacted by commodity price fluctuations, economic cycles, environmental liabilities, and regulations, all of which can affect their returns. Small and mid-cap companies may face higher market risk, greater price volatility, and lower liquidity than larger firms.
Investments in MLPs involve unique risks, such as price volatility, illiquidity, limited investor control, potential conflicts of interest, dilution risks, and insufficient cash flow to meet operating requirements. MLPs may also face industry-specific challenges and macroeconomic pressures. The Fund’s returns depend on MLPs being taxed as partnerships, not corporations. Changes in tax laws or policies can reduce MLP cash distributions and negatively affect the Fund’s investments.
Investment Adviser: Amplify Investments LLC; Sub-Adviser: Samsung Asset Management (New York), Inc.