
Overview
Why Invest in THNR ETF?
- Significant Growth Opportunity: The weight loss drug market is anticipated to grow from $15 billion in 2024 to $150 billion by 2035.1
- Increasing Demand: Pharmaceutical companies are accelerating production to meet demand as over 42% of U.S. adults and 1 billion people worldwide are obese.2
- Diversified Access: A global equity portfolio of companies pioneering GLP-1 or Amylin therapies and telehealth providers facilitating access to them.
Objective & Strategy
THNR provides access to global companies expected to economically benefit from weight loss drug development. THNR seeks investment results that generally correspond to the performance (before fees and expenses) of the VettaFi Weight Loss Drug & Treatment Index.
Beyond the Scale:
Recent studies have shown that GLP-1 drugs (glucagon-like peptide-1 agonists) have led to a 10-20% reduction in body-weight and lowered the risk of heart attack, stroke and cardiovascular death by approximately 20%.3
Key Information
Fund Details
| Ticker | THNR |
| Launch Date | 05/21/2024 |
| Primary Exchange | NYSE Arca |
| CUSIP | 032108532 |
| Net Assets | $4,495,118 |
| Shares Outstanding | 170,000 |
| Holdings (view all holdings) | 20 |
| Total Expense Ratio i | 0.59% |
Index Details
| Index Name | VettaFi Weight Loss Drug & Treatment Index |
| Index Ticker | THINR |
| Index Provider | VettaFi |
| Weighting Methodology | Float-Adjusted Market Cap |
| Rebalance Frequency | Quarterly |
| Index Website | VettaFi.com |
Selection Methodology
Eligible Universe
Companies must have:
- Market capitalization >= $500 million
- Three-month average daily trading volume >= $1 million
Security Selection
Select 20 constituents who classify as either:
- Commercial Drugs
- Phase 3 Drugs
- Phase 2 Drugs and Below
- Combination Therapies
- Telehealth
Weighting
Each security weighted by its float-adjusted market cap, capped based on stage of development & company type.
Rebalancing
Quarterly rebalance in March, June, September & December.
Performance & Holdings
Performance
| Cumulative (%) | Annualized (%) | |||||||||
|---|---|---|---|---|---|---|---|---|---|---|
| 1MO | 3MO | 6MO | YTD | Since Inception | 1YR | 3YR | 5YR | 10YR | Since Inception | |
| NAV | 3.01% | 5.12% | 1.93% | 1.93% | 4.50% | 15.21% | — | — | — | 2.11% |
| Closing Price | 3.08% | 4.50% | 1.87% | 1.87% | 4.59% | 15.03% | — | — | — | 2.15% |
| S&P 500 TR | -0.95% | 15.20% | 10.21% | 10.21% | 45.13% | 22.32% | — | — | — | 19.28% |
| VettaFi Weight Loss Drug & Treatment Total Return Index (USD) | 3.07% | 5.38% | 2.36% | 2.36% | 6.12% | 16.30% | — | — | — | 2.85% |
The performance data quoted represents past performance and does not guarantee future results. Investment return and principal value of an investment will fluctuate so that an investor’s shares, when sold or redeemed, may be worth more or less than the original cost. Current performance may be lower or higher than the performance quoted. For most recent month end performance, visit AmplifyETFs.com/SWAN. Brokerage commissions will reduce returns. NAV is the sum of all its assets less any liabilities, divided by the number of shares outstanding. The closing price is the last price at which the fund traded.
Indexes are unmanaged and it’s not possible to invest directly in an index. The VettaFi Weight Loss Drug & Treatment Index is a float-adjusted market cap weighted index comprised of global companies who are weight loss drug manufacturers or telehealth providers facilitating access of them.
Top 10 Holdings
| Name | Ticker | Market Value (%) | CUSIP | Shares | Market Value ($) |
|---|---|---|---|---|---|
| Novo Nordisk A/S | NVO | 9.96% | 670100205 | 8,881 | $447,869 |
| Eli Lilly & Co | LLY | 9.10% | 532457108 | 337 | $409,088 |
| Hims & Hers Health Inc | HIMS | 5.74% | 433000106 | 7,013 | $258,078 |
| Scholar Rock Holding Corp | SRRK | 5.53% | 80706P103 | 4,531 | $248,661 |
| AbbVie Inc | ABBV | 5.23% | 00287Y109 | 901 | $235,224 |
| Innovent Biologics Inc | 1801 HK | 5.21% | BGR6KX5 | 21,500 | $233,971 |
| Viking Therapeutics Inc | VKTX | 5.12% | 92686J106 | 6,142 | $229,956 |
| Arrowhead Pharmaceuticals Inc | ARWR | 5.09% | 04280A100 | 2,722 | $228,621 |
| Regeneron Pharmaceuticals Inc | REGN | 4.96% | 75886F107 | 341 | $223,106 |
| AstraZeneca PLC | AZN | 4.96% | G0593M107 | 1,143 | $223,056 |
Fund holdings are subject to change at any time and should not be considered recommendations to buy or sell any security.
Allocation

Distributions
| Ex-Date | Record Date | Payable Date | Amount (USD) |
|---|---|---|---|
| 12/30/2026 | 12/30/2026 | 12/31/2026 | — |
There is no guarantee that distributions will be made.
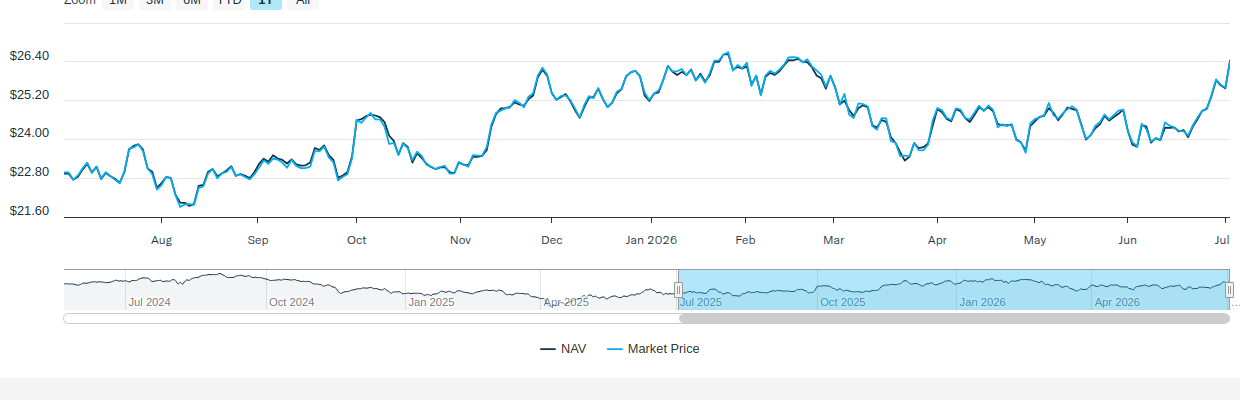
Price
NAV/Market Price
| Previous Day's NAV | |
|---|---|
| Net Asset Value: | $26.44 |
| Daily Change: | $0.86 |
| % Daily Change: | 3.37% |
| 30-Day Median Bid/Ask Spread: | 0.35% |
| Previous Day's Market Price | |
|---|---|
| Closing Price: | $26.41 |
| Daily Change: | $0.81 |
| % Daily Change: | 3.15% |
| % Premium/Discount: | -0.12% |
Daily Price/NAV Performance
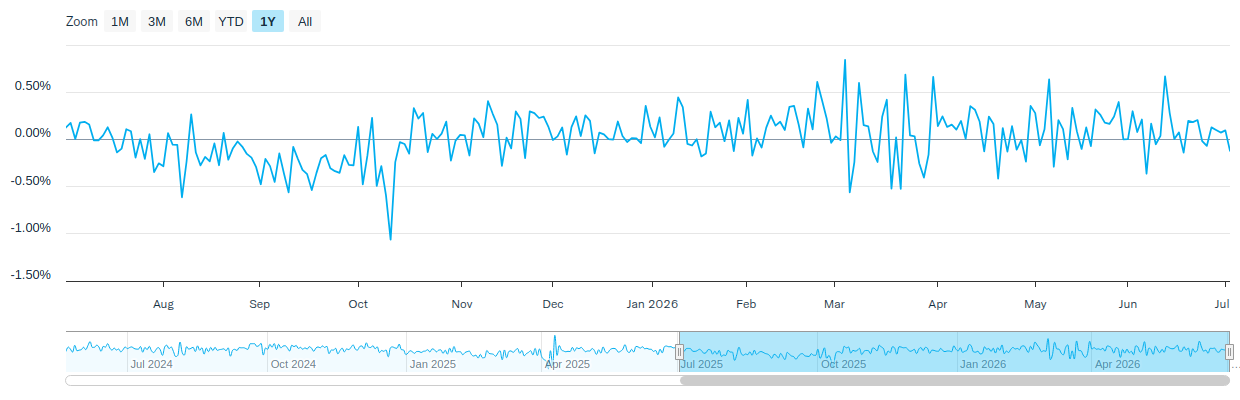
Premium/Discount
| 2025 | Q1 2026 | Q2 2026 | Q3 2026 | Q4 2026 | |
|---|---|---|---|---|---|
| Days Traded at Premium | 120 | 39 | 46 | - | - |
| Days Traded at NAV | 0 | 0 | 0 | - | - |
| Days Traded at Discount | 131 | 22 | 16 | - | - |
The table and line graph are provided to show the frequency at which the closing price of the Fund was at a premium (above) or discount (below) to the Fund’s daily net asset value (“NAV”). The table and line graph represent past performance and cannot be used to predict future results. Shareholders may pay more than NAV when buying Fund shares and receive less than an NAV when those shares are sold because shares are bought and sold at current market prices.
Literature
Fund Resources
Insights
International Insights: Investing Across the Globe - May 2026
June 8, 2026
Audio Commentary by Tim Seymour, IDVO Portfolio Manager
Climate Capital: The Case for ESG Investing
May 22, 2026
In an era where climate change debates heat the political sphere, many savvy business owners and investors are turning their focus toward a cooler, more sustainable future.
The Digital Economy Is Built on Real Assets
May 20, 2026
Artificial intelligence and the digital economy are driving unprecedented demand for electricity and critical materials—creating a new energy supercycle.
How to Invest
Amplify ETFs trade throughout the day, similar to publicly-traded stocks, on an exchange. There are multiple ways to invest in Amplify ETFs:
- Contact a Financial Advisor to discover how Amplify ETFs may fit within your portfolio.
- Amplify ETFs are available through various online platforms and brokerage accounts.
Connect with your ETF Specialst or call (855) 267-3837
1Morgan Stanley, Exponential Growth of Obesity Drugs, 5/2025.
2World Health Organization, One in Eight People Are Now Living with Obesity, 03/2024. Pew Research Center, As Obesity Rates Rise in the US and Worldwide, New Weight Loss Drugs Surge in Popularity, 03/2024.
3Morgan Stanley, GLP-1: The Weight of Speculation, 12/2023. Medscape, Semaglutide Cuts Cardiovascular Events in Landmark Trial, 08/2023.
Investing involves risk, including the possible loss of principal. There can be no assurance that the Fund’s investment objectives will be achieved. The fund is new with limited operating history. Shares of any ETF are bought and sold at market price (not NAV), may trade at a discount or premium to NAV and are not individually redeemed from the Fund. The Fund invests in securities included in its Index regardless of their investment merit and may experience tracking error: the differences in timing of trades, valuation, plus fees and expenses between fund and index.
A non-diversified fund and can invest a greater portion of its assets in securities of individual issuers which could cause greater fluctuations than a diversified fund. A narrowly focused portfolio concentrated in the pharmaceutical industry or healthcare sector, may exhibit higher volatility and be vulnerable to factors affecting them due to regulation, litigation, costs and competition.
Small and/or mid-capitalization companies may be more vulnerable to adverse general market or economic developments. Investments in foreign securities, especially in emerging markets, involve greater volatility and political, economic, and currency risks and differences in accounting methods beyond those of securities of U.S. issuers.
Amplify Investments LLC serves as the investment adviser to the Fund. Penserra Capital Management LLC serves as investment sub-adviser to the Fund.