Fund Details
| Ticker | CNBS |
| Launch Date | 7/23/2019 |
| Primary Exchange | NYSE Arca |
| CUSIP | 032108482 |
| Net Assets | N/A |
| Shares Outstanding | N/A |
| # of Holdings (view all holdings) | N/A |
| Fees & Expenses | |
| Management Fee | 0.65% |
| Other Expenses | 0.68% |
| Acquired Fund Fees & Expenses | 0.01% |
| Total Annual Fund Operating Expenses | 1.34% |
| Less Fee Waiver/Reimbursement1 | 0.58% |
| Net Expense Ratio | 0.76% |
Fund Characteristics
| Weighted Avg. Market Cap | N/A |
| Price-to-earnings | N/A |
| Price-to-book | N/A |
| Standard deviation | N/A |
Standard deviation measures how dispersed returns are around the average. A higher standard deviation indicates that returns are spread out over a larger range of values and thus, more volatile.
Index Details
| Index Name | EQM Lithium & Battery Technology Index |
| Index Ticker | BATTIDX |
| Index Provider | EQM Indexes |
| Weighting Methodology | Modified market-cap |
| Rebalance Frequency | Quarterly |
| Index Website | eqmindexes.com |
Fund Documents
Signup to receive updates on
CNBS
Why Invest in CNBS?
- Green Rush Growth Potential: In the U.S., sales of legal recreational cannabis are expected to grow from $32.1 billion in 2024 to reach nearly $58 billion by 2030.1
- Active Management: Allows for timely decisions in this dynamic space. Tim Seymour is an experienced investor and recognized voice in the cannabis sector.
- Convenient Access: Through a single ETF, gain convenient access to a basket of companies across the cannabis and hemp ecosystem.
Objective and Strategy
CNBS is an actively managed ETF that provides diversified U.S. exposure across the cannabis ecosystem including cannabis: plants, support, and ancillary businesses. CNBS seeks to provide capital appreciation.
The Cannabis Recap
- The Cannabis Recap - June 16, 2025
Audio Commentary by Tim Seymour

Tim covers a full slate of topics in 3 key areas:
- Markets (companies, earnings, M&A activity, performance)
- Macro (state and federal legislative landscape)
- Portfolio dynamics (CNBS & MJ)
NAV and Market Price
| Previous Day's NAV | Previous Day's Market Price | |||
|---|---|---|---|---|
| Net Asset Value | N/A | Closing Price | N/A | |
| Daily Change | N/A | Daily Change | N/A | |
| % Daily Change | N/A | % Daily Change | N/A | |
| 30-Day Median Bid/Ask Spread | N/A | Premium/Discount % | N/A | |
| Premium Discount History | ||||
Daily Price/NAV Performance
Effective on February 21, 2025, the Fund participated in a reverse share split ratio of 1 for 12.
Fund Holdings
| TOP 10 HOLDINGS | |||
|---|---|---|---|
Fund holdings are subject to change at any time and should not be considered recommendations to buy or sell any security.
CNBS Portfolio Selection
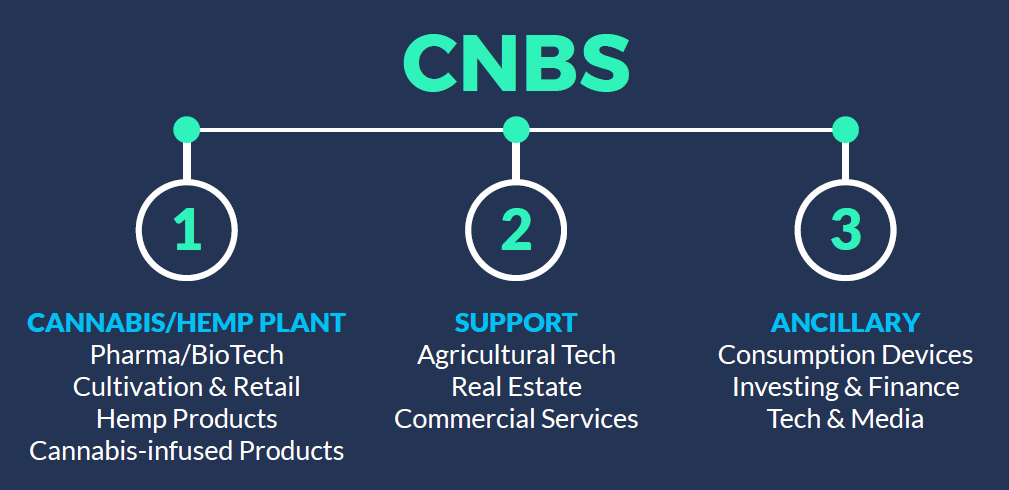
CNBS invests at least 80% of its assets in securities of companies that derive 50% or more of their revenue from the cannabis and hemp ecosystem, across one of three classifications:

Tim Seymour has over 20 years of investment experience as a portfolio manager, allocator, and capital markets professional across multiple asset classes. Mr. Seymour has been an early stage investor in the cannabis industry and serves as a board member or in an advisory role for several private cannabis companies. In addition, Mr. Seymour is a frequent and long-time contributor on CNBC, including over a decade as co-host on the show “Fast Money.” Mr. Seymour is the founder and Chief Investment Officer of Seymour Asset Management (“SAM”).
Market Allocation
Market Capitalization
| LARGE CAP (> $10B): | N/A |
| MID CAP ($2B - $10B): | N/A |
| SMALL CAP ($300M - < $2B): | N/A |
Fund holdings are subject to change at any time and should not be considered recommendations to buy or sell any security.
Performance
| CUMULATIVE (%) | ANNUALIZED (%) | ||||||||
|---|---|---|---|---|---|---|---|---|---|
| 1 Mo. | 3 Mo. | 6 Mo. | YTD | Since Inception | 1 Yr. | 3 Yr. | 5 Yr. | Since Inception | |
| Month end as of TBD | |||||||||
| NAV | N/A | N/A | N/A | N/A | N/A | N/A | N/A | N/A | N/A |
| Closing Price | N/A | N/A | N/A | N/A | N/A | N/A | N/A | N/A | N/A |
| Quarter end as of TBD | |||||||||
| NAV | N/A | N/A | N/A | N/A | N/A | N/A | N/A | N/A | N/A |
| Closing Price | N/A | N/A | N/A | N/A | N/A | N/A | N/A | N/A | N/A |
Fund inception date: 7/22/2019. The performance data quoted represents past performance and does not guarantee future results. Investment return and principal value of an investment will fluctuate so that an investor's shares, when sold or redeemed, may be worth more or less than the original cost. Current performance may be lower or higher than the performance quoted. Brokerage commissions will reduce returns. NAV is the sum of all its assets less any liabilities, divided by the number of shares outstanding. The closing price is the last price at which the fund traded.
Premium/Discount
The table and line graph are provided to show the frequency at which the closing price of the Fund was at a premium (above) or discount (below) to the Fund's daily net asset value ("NAV"). The table and line graph represent past performance and cannot be used to predict future results. Shareholders may pay more than NAV when buying Fund shares and receive less than an NAV when those shares are sold because shares are bought and sold at current market prices.
This is your Counts mockup
| Calendar Year | Calendar Year through | |
|---|---|---|
| Days traded at premium | N/A | N/A |
| Days traded at net asset value | N/A | N/A |
| Days traded at discount | N/A | N/A |
CNBS Distributions
There is no guarantee that distributions will be made.
Effective on February 21, 2025, the Fund participated in a reverse share split ratio of 1 for 12.
Investing involves risk, including the possible loss of principal. Shares of any ETF are bought and sold at market price (not NAV), may trade at a discount or premium to NAV, and are not individually redeemed from the Fund. Brokerage commissions will reduce returns.
The Fund is subject to management risk because it is an actively managed. Companies involved in the cannabis industry face competition, may have limited access to the services of banks, may have substantial burdens on company resources due to litigation, complaints or enforcement actions, and are heavily dependent on receiving necessary permits and authorizations to engage in medical cannabis research or to otherwise cultivate, possess or distribute cannabis. The possession and use of cannabis, even for medical purposes, is illegal under federal and certain states’ laws, which may negatively impact the value of the Fund’s investments. Securities issued by non-U.S. companies present risks beyond those of securities of U.S. issuers.
Many of the companies in which the Fund will invest are engaged in other lines of business unrelated to cannabis and these lines of business could adversely affect their operating results. Cannabis is a Schedule I controlled substance under the Controlled Substances Act (“CSA”), meaning that it has a high potential for abuse, has no currently “accepted medical use” in the U.S., lacks accepted safety for use under medical supervision, and may not be prescribed, marketed or sold in the U.S. Small and/or mid-capitalization companies may be more vulnerable to adverse general market or economic developments, and their securities may be less liquid and may experience greater price volatility than larger, more established companies as a result of several factors, including limited trading volumes, products or financial resources, management inexperience and less publicly available information. The Fund is non-diversified, which can cause greater share price fluctuation.
Amplify Investments LLC serves as the investment adviser to the Fund. Seymour Asset Management LLC and Tidal Financial LLC serve as investment sub-advisers to the Fund.
Amplify ETFs are distributed by Foreside Fund Services, LLC.


