

| 13.87% |
| Distribution Rate i Distribution Rate is the normalized current distribution (annualized) over NAV per share. Distributions may include return of capital (ROC). Click on "All Distributions→" to view Form 19a-1. |
| 13.59% |
| 30-Day SEC Yield i 30-Day SEC Yield is a standard yield calculation developed by the Securities and Exchange Commission that allows for fairer comparisons among bond funds. It is based on the most recent month end. This figure reflects the income earned from dividends – excluding option income – during the period after deducting the Fund’s expenses for the period. |
| Monthly |
| Distribution Frequency |
Overview
★★★★
Overall Morningstar RatingTM
Based on risk adjusted returns among 217 funds in the Tactical Allocation category (as of 3/31/26).
Why Invest in YYY ETF?
- Distribution Potential: YYY seeks to pay a high level of current income on a monthly basis.
- Appreciation Potential: Purchasing shares of closed-end funds (CEFs) below net asset value, also referred to as a discount, may provide potential for appreciation.
- Diversification: YYY holds 60 CEFs diversified by asset class and CEF issuers.
Objective & Strategy
The Amplify CEF High Income ETF (YYY)1 is a portfolio of 60 closed-end funds (CEFs) based on a rules based index. The Nasdaq CEF High Income Index selects CEFs ranked highest overall by Nasdaq in the following factors: Yield, Discount to Net Asset Value (NAV), and Liquidity. This investment approach results in a portfolio which contains a variety of asset classes, investment strategies and asset managers.
Key Information
Fund Details
| Ticker | YYY |
| Launch Date | 06/12/2012 |
| Primary Exchange | NYSE Arca |
| CUSIP | 032108847 |
| Net Assets | $655,216,475 |
| Shares Outstanding | 63,950,000 |
| Holdings (view all holdings) | 60 |
Fees & Expenses
| Management Fee | 0.50% |
| Acquired Fund Fees & Expenses | 2.73% |
| Total Expense Ratio | 3.23%iAs of most recent prospectus |
Index Details
| Index Name | Nasdaq CEF High Income Index |
| Index Ticker | YLDATR |
| Index Provider | Nasdaq, Inc. |
| Weighting Methodology | Modified Yield Weight |
| Rebalance Frequency | Semi-Annual |
| Index Website | Nasdaq Global Indexes |
Selection Methodology
Eligible Universe
CEFs must be organized in the US and shares listed on US exchanges.
Initial Selection
Eligible constituents are ranked based on yield, discount and liquidity characteristics to determine status as a Tier 1 or Tier 2 constituent. Eligible constituents expense ratio may not exceed a 6%.
Weighting
Funds are weighted based on yield. The top 30 Tier 1 funds may not exceed 3.5% and the remaining Tier 1 or Tier 2 funds may not exceed 2%.
Rebalance
The Index is rebalanced semi-annually in January and July.
Performance & Holdings
Performance
| Cumulative (%) | Annualized (%) | |||||||||
|---|---|---|---|---|---|---|---|---|---|---|
| 1MO | 3MO | 6MO | YTD | Since Inception | 1YR | 3YR | 5YR | 10YR | Since Inception | |
| NAV | -6.42% | -6.91% | 0.62% | -0.81% | 113.17% | -0.11% | 10.77% | 2.33% | 4.43% | 5.43% |
| Closing Price | -6.50% | -6.98% | 0.30% | -0.83% | 112.32% | -0.34% | 10.60% | 2.22% | 4.36% | 5.40% |
| Nasdaq CEF High Income Index | -6.42% | -6.80% | 0.97% | -0.31% | 109.07% | 0.54% | 11.50% | 2.86% | 4.99% | 5.29% |
| Cumulative (%) | Annualized (%) | |||||||||
|---|---|---|---|---|---|---|---|---|---|---|
| 1MO | 3MO | 6MO | YTD | Since Inception | 1YR | 3YR | 5YR | 10YR | Since Inception | |
| NAV | -6.42% | -6.91% | 0.62% | -0.81% | 113.17% | -0.11% | 10.77% | 2.33% | 4.43% | 5.43% |
| Closing Price | -6.50% | -6.98% | 0.30% | -0.83% | 112.32% | -0.34% | 10.60% | 2.22% | 4.36% | 5.40% |
| Nasdaq CEF High Income Index | -6.42% | -6.80% | 0.97% | -0.31% | 109.07% | 0.54% | 11.50% | 2.86% | 4.99% | 5.29% |
The performance data quoted represents past performance and does not guarantee future results. Investment return and principal value of an investment will fluctuate so that an investor’s shares, when sold or redeemed, may be worth more or less than the original cost. Current performance may be lower or higher than the performance quoted. Brokerage commissions will reduce returns. NAV is the sum of all its assets less any liabilities, divided by the number of shares outstanding. The closing price is the last price at which the fund traded.
Indexes are unmanaged and it’s not possible to invest directly in an index. *The inception date of the Amplify CEF High Income ETF (YYY) was June 21, 2013. On that date, a previous fund from a Sponsor unrelated to Amplify ETFs was converted into the current fund and investment objective. As a result, the Fund’s investment objective and principal investment strategies were revised; therefore, the performance and average annual total returns shown for periods prior to June 21, 2013 may have differed had the Fund’s current investment strategies been in effect during those periods. The previous fund was called the Sustainable North American Oil Sands ETF (SNDS) and had an inception of June 12, 2012.
Top 10 Holdings
| Name | Ticker | Market Value (%) | CUSIP | Shares | Market Value ($) |
|---|---|---|---|---|---|
| abrdn Total Dynamic Dividend Fund | AOD | 3.66% | 00326L100 | 2,371,449 | $23,975,349 |
| Nuveen Floating Rate Income Fund/Closed-end Fund | JFR | 3.35% | 67072T108 | 3,023,097 | $21,977,915 |
| BlackRock ESG Capital Allocation Term Trust | ECAT | 3.22% | 09262F100 | 1,599,449 | $21,096,732 |
| Tortoise Energy Infrastructure Corp | TYG | 3.14% | 89147L886 | 536,990 | $20,582,827 |
| Guggenheim Strategic Opportunities Fund | GOF | 3.09% | 40167F101 | 2,384,855 | $20,247,419 |
| PIMCO High Income Fund | PHK | 3.03% | 722014107 | 4,918,362 | $19,820,999 |
| Nuveen Credit Strategies Income Fund | JQC | 2.69% | 67073D102 | 3,909,516 | $17,592,822 |
| abrdn Global Infrastructure Income Fund | ASGI | 2.50% | 00326W106 | 843,977 | $16,373,154 |
| PIMCO Access Income Fund | PAXS | 2.45% | 72203T100 | 1,246,142 | $16,062,770 |
| PIMCO Income Strategy Fund II | PFN | 2.45% | 72201J104 | 2,605,128 | $16,021,537 |
Fund holdings are subject to change at any time and should not be considered recommendations to buy or sell any security.
Allocation
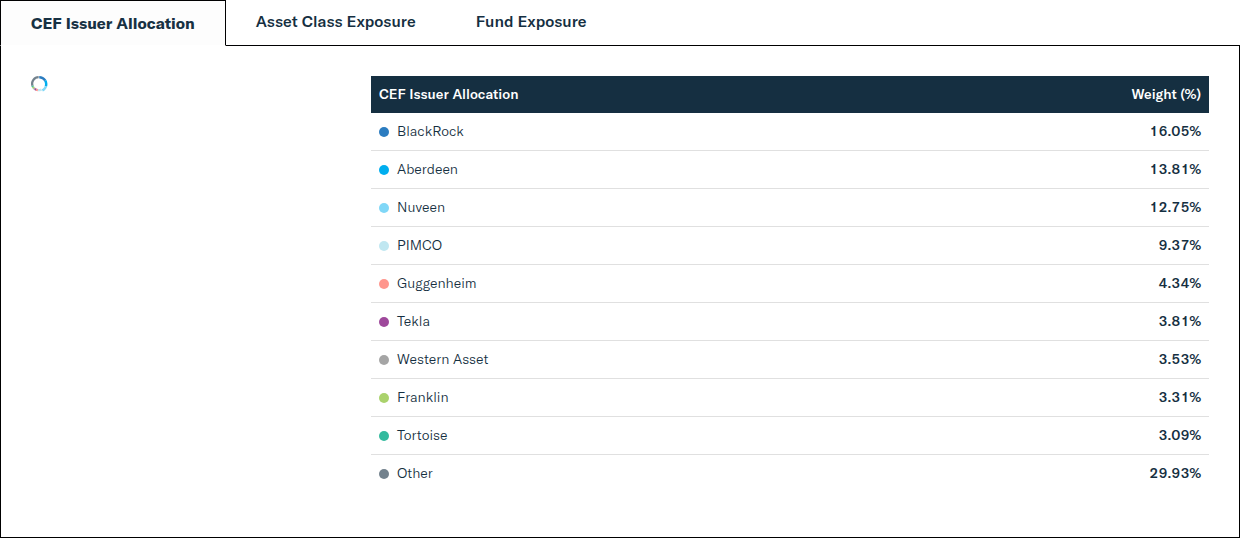
| CEF Issuer Allocation | Weight (%) |
|---|---|
| BlackRock | 16.05% |
| Aberdeen | 13.81% |
| Nuveen | 12.75% |
| PIMCO | 9.37% |
| Guggenheim | 4.34% |
| Tekla | 3.81% |
| Western Asset | 3.53% |
| Franklin | 3.31% |
| Tortoise | 3.09% |
| Other | 29.93% |
| Asset Class Exposure | Weight (%) |
|---|---|
| Multisector | 26.95% |
| High Yield | 14.27% |
| Bank Loans | 12.92% |
| Equity: Sector | 11.64% |
| Equity: Thematic | 9.33% |
| U.S. Equity | 5.24% |
| Emerging Market | 5.03% |
| Global Equity | 3.65% |
| Global Income | 3.57% |
| Other | 7.41% |
| Fund Exposure | Weight (%) |
|---|---|
| Bonds | 55.98% |
| Stocks | 33.75% |
| Hybrid | 10.27% |
Distributions & Yields
Distributions
| Ex-Date | Record Date | Payable Date | Amount (USD) |
|---|---|---|---|
| 01/29/2026 | 01/29/2026 | 01/30/2026 | $0.12000 |
| 02/26/2026 | 02/26/2026 | 02/27/2026 | $0.12000 |
| 03/30/2026 | 03/30/2026 | 03/31/2026 | $0.12000 |
| 04/29/2026 | 04/29/2026 | 04/30/2026 | $0.12000 |
| 05/28/2026 | 05/28/2026 | 05/29/2026 | $0.12000 |
| 06/29/2026 | 06/29/2026 | 06/30/2026 | $0.12000 |
| 07/30/2026 | 07/30/2026 | 07/31/2026 | $0.12000 |
| 08/28/2026 | 08/28/2026 | 08/31/2026 | $0.12000 |
| 09/29/2026 | 09/29/2026 | 09/30/2026 | $0.12000 |
| 10/29/2026 | 10/29/2026 | 10/30/2026 | — |
| 11/27/2026 | 11/27/2026 | 11/30/2026 | — |
| 12/30/2026 | 12/30/2026 | 12/31/2026 | — |
Yields
| Distribution Rate | 13.87% | 30-Day SEC Yield | 13.59% |
| Distribution Frequency | Monthly |
There is no guarantee that distributions will be made. Distributions may include income, capital gains, or return of capital and may vary during the year, details in the Fund’s Form 19a‑1.
Price
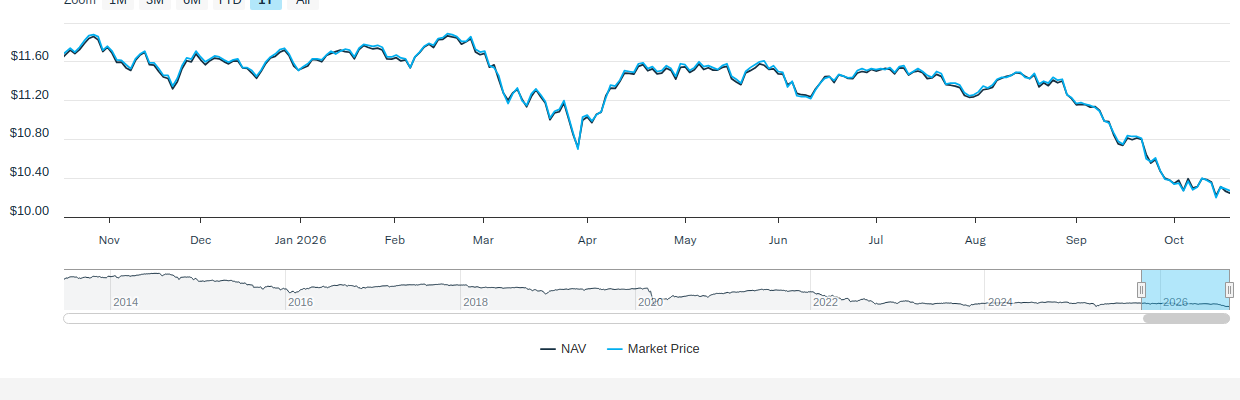
NAV/Market Price
| Previous Day's NAV | |
|---|---|
| Net Asset Value: | $10.25 |
| Daily Change: | $-0.02 |
| % Daily Change: | -0.20% |
| 30-Day Median Bid/Ask Spread: | 0.10% |
| Previous Day's Market Price | |
|---|---|
| Closing Price: | $10.27 |
| Daily Change: | $-0.02 |
| % Daily Change: | -0.19% |
| % Premium/Discount: | 0.24% |
Daily Price/NAV Performance
Premium/Discount
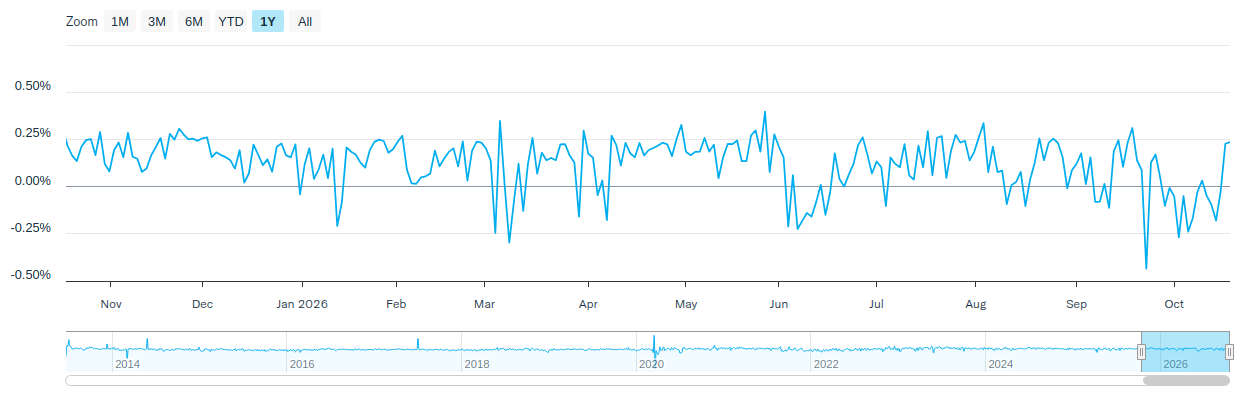
| 2025 | Q1 2026 | Q2 2026 | Q3 2026 | Q4 2026 | |
|---|---|---|---|---|---|
| Days Traded at Premium | 223 | 54 | 51 | 54 | - |
| Days Traded at NAV | 0 | 0 | 1 | 0 | - |
| Days Traded at Discount | 28 | 7 | 10 | 10 | - |
The table and line graph are provided to show the frequency at which the closing price of the Fund was at a premium (above) or discount (below) to the Fund’s daily net asset value (“NAV”). The table and line graph represent past performance and cannot be used to predict future results. Shareholders may pay more than NAV when buying Fund shares and receive less than an NAV when those shares are sold because shares are bought and sold at current market prices.
Literature
Fund Resources
Insights
BNAV Commentary 3Q 2026
October 16, 2026
Bitcoin: a technical take, divergence from Tech, and year-end tax considerations.
International Insights: Investing Across the Globe - September 2026
October 13, 2026
Audio Commentary by Tim Seymour, IDVO Portfolio Manager
Why Top 10 ETFs? Small Group. Big Impact. ETF Watch
September 22, 2026
Focused exposure to leading companies across quantum computing, space, robotics, and Asia memory semiconductors.
How to Invest
Amplify ETFs trade throughout the day, similar to publicly-traded stocks, on an exchange. There are multiple ways to invest in Amplify ETFs:
- Contact a Financial Advisor to discover how Amplify ETFs may fit within your portfolio.
- Amplify ETFs are available through various online platforms and brokerage accounts.
Connect with your ETF Specialist or call (855) 267-3837
1Amplify High Income ETF renamed on/about 10/13/25.
Investing involves risk, including the possible loss of principal. There is no guarantee that the fund will meet its investment objective. Because the Fund is a fund of funds, its investment performance largely depends on the investment performance of the Underlying Funds in which it invests. The Fund is subject to the risks associated with the Underlying Funds that comprise the Index, including risks related to derivatives, REITs, foreign securities and municipal securities. Fixed-income securities’ prices generally fall as interest rates rise. High yield securities risk includes an issuer’s inability to meet principal and interest payments and may be experience greater volatility. Preferred stock may not pay or suspend dividend payments and may call or redeem to convert it to common stock. Investments in foreign securities, especially emerging markets, involve greater volatility and political, economic, and currency risks and differences in accounting methods. The Fund will pay indirectly a proportional share of the fees and expenses of the Underlying Funds in which it invests, including their investment advisory and administration fees, in addition to its own fees and expenses. Certain markets segments may be out of favor and underperform. Fund’s underlying holdings may be leveraged and may cause higher volatility and impact of any losses.
Amplify Investments LLC serves as the Investment Advisor and Penserra Capital Management LLC serves as sub-advisor to the Fund.