

Overview
Why Invest in AIEQ ETF?
- Harnesses The Power of AI: Strategy uses IBM Watson for machine learning, sentiment analysis and natural language processing to select securities for the EquBot index.
- Quantitative Computing: Equbot model utilizes AI to analyze data points across news, social media, industry and analyst reports, and financial statements on thousands of U.S. companies, technical, macro, market data and more.
- Access For Everyone: Previously only available to hedge funds and professional trading firms, this method of stock selection is now accessible as an efficient solution in an ETF.
Objective & Strategy
The Amplify AI Powered Equity ETF (AIEQ) seeks investment results that generally correlate (before fees and expenses) to the total return performance of the AI Powered Equity Index that runs on the IBM Watson™ platform. Leveraging the power of artificial intelligence (AI), the unbiased and data-driven approach revolutionizes security selection by harnessing up to 10 years of historical data and then applying this analysis to recent economic data and news articles to transform security selection.
Key Information
Fund Details
| Ticker | AIEQ |
| Launch Date | 10/17/2017 |
| Primary Exchange | NYSE Arca |
| CUSIP | 032108565 |
| Net Assets | $112,055,398 |
| Shares Outstanding | 2,300,000 |
| Holdings (view all holdings) | 161 |
| Total Expense Ratio i | 0.75% |
Index Details
| Index Name | AI Powered Equity Index |
| Index Ticker | AIEQTR |
| Index Provider | EquBot Inc. |
| Weighting Methodology | Proprietary |
| Rebalance Frequency | Monthly |
| Index Website | EquBot |
Performance & Holdings
Performance
| Cumulative (%) | Annualized (%) | |||||||||
|---|---|---|---|---|---|---|---|---|---|---|
| 1MO | 3MO | 6MO | YTD | Since Inception | 1YR | 3YR | 5YR | 10YR | Since Inception | |
| NAV | -2.98% | -1.02% | 13.30% | 8.79% | 127.45% | 9.70% | 18.58% | 4.45% | — | 9.61% |
| Closing Price | -2.91% | -0.64% | 13.63% | 8.82% | 126.57% | 9.91% | 18.63% | 4.44% | — | 9.57% |
| AI Powered Equity Index (TR) | -2.93% | -0.84% | 13.69% | 9.34% | — | 10.45% | — | — | — | — |
| Cumulative (%) | Annualized (%) | |||||||||
|---|---|---|---|---|---|---|---|---|---|---|
| 1MO | 3MO | 6MO | YTD | Since Inception | 1YR | 3YR | 5YR | 10YR | Since Inception | |
| NAV | -2.98% | -1.02% | 13.30% | 8.79% | 127.45% | 9.70% | 18.58% | 4.45% | — | 9.61% |
| Closing Price | -2.91% | -0.64% | 13.63% | 8.82% | 126.57% | 9.91% | 18.63% | 4.44% | — | 9.57% |
| AI Powered Equity Index (TR) | -2.93% | -0.84% | 13.69% | 9.34% | — | 10.45% | — | — | — | — |
The performance data quoted represents past performance and does not guarantee future results. Investment return and principal value of an investment will fluctuate so that an investor’s shares, when sold or redeemed, may be worth more or less than the original cost. Current performance may be lower or higher than the performance quoted. Brokerage commissions will reduce returns. NAV is the sum of all its assets less any liabilities, divided by the number of shares outstanding. The closing price is the last price at which the fund traded.
Indexes are unmanaged and it’s not possible to invest directly in an index. The AI Powered Equity Index tracks the performance of companies selected by an AI data-driven quantitative model that factors in recent economic events and news.
Top 10 Holdings
| Name | Ticker | Market Value (%) | CUSIP | Shares | Market Value ($) |
|---|---|---|---|---|---|
| Broadcom Inc | AVGO | 8.62% | 11135F101 | 30,034 | $9,661,337 |
| Netflix Inc | NFLX | 4.15% | 64110L106 | 70,593 | $4,648,549 |
| Mastercard Inc | MA | 4.15% | 57636Q104 | 7,452 | $4,647,067 |
| Tyson Foods Inc | TSN | 4.12% | 902494103 | 81,497 | $4,620,880 |
| Berkshire Hathaway Inc | BRK/B | 4.00% | 084670702 | 8,257 | $4,476,863 |
| NVIDIA Corp | NVDA | 3.69% | 67066G104 | 19,584 | $4,131,441 |
| Uber Technologies Inc | UBER | 3.57% | 90353T100 | 60,044 | $4,004,935 |
| GE Vernova Inc | GEV | 3.15% | 36828A101 | 4,336 | $3,533,840 |
| ONEOK Inc | OKE | 2.87% | 30609A109 | 33,564 | $3,216,438 |
| Alphabet Inc | GOOG | 2.66% | 02079K107 | 9,377 | $2,975,135 |
Fund holdings are subject to change at any time and should not be considered recommendations to buy or sell any security.
Allocation
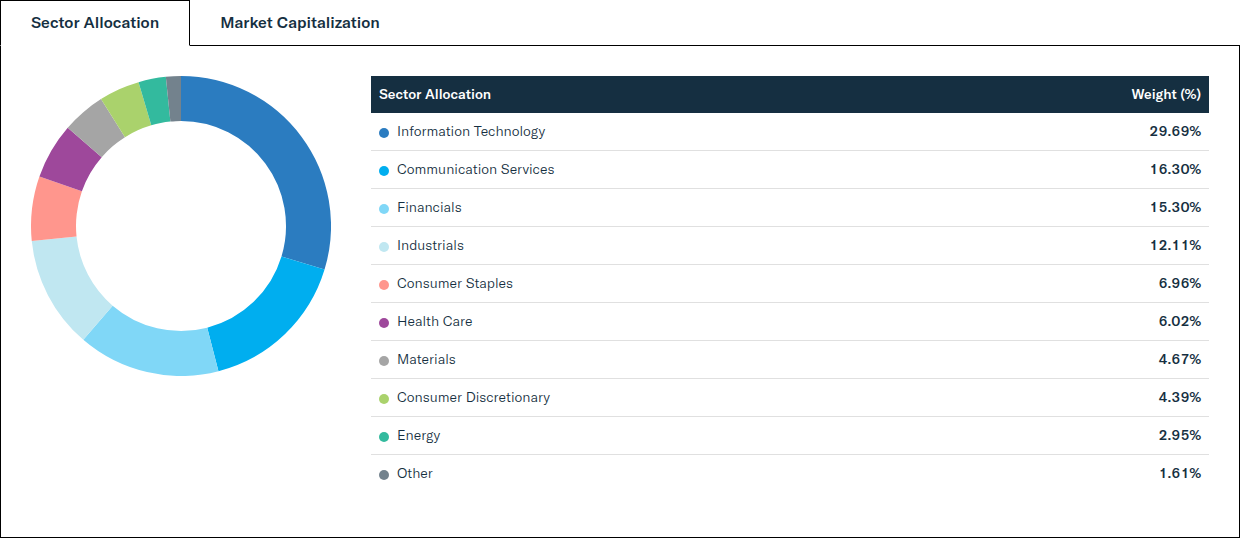
| Sector Allocation | Weight (%) |
|---|---|
| Information Technology | 29.69% |
| Communication Services | 16.30% |
| Financials | 15.30% |
| Industrials | 12.11% |
| Consumer Staples | 6.96% |
| Health Care | 6.02% |
| Materials | 4.67% |
| Consumer Discretionary | 4.39% |
| Energy | 2.95% |
| Other | 1.61% |
| Market Capitalization | Weight (%) |
|---|---|
| Large Capitalization (> $10B) | 98.51% |
| Mid Capitalization ($2B - $10B) | 1.49% |
| Small Capitalization ($300M - < $2B) | 0.00% |
Distributions
| Ex-Date | Record Date | Payable Date | Amount (USD) |
|---|---|---|---|
| 12/30/2026 | 12/30/2026 | 12/31/2026 | — |
There is no guarantee that distributions will be made.
Price
NAV/Market Price
| Previous Day's NAV | |
|---|---|
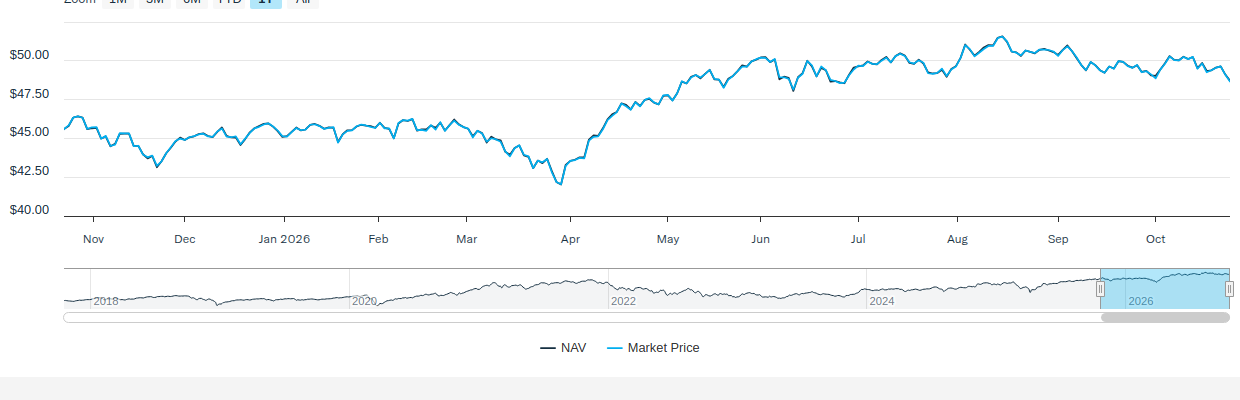
| Net Asset Value: | $48.72 |
| Daily Change: | $-0.39 |
| % Daily Change: | -0.80% |
| 30-Day Median Bid/Ask Spread: | 0.30% |
| Previous Day's Market Price | |
|---|---|
| Closing Price: | $48.66 |
| Daily Change: | $-0.43 |
| % Daily Change: | -0.88% |
| % Premium/Discount: | -0.12% |
Daily Price/NAV Performance
Premium/Discount
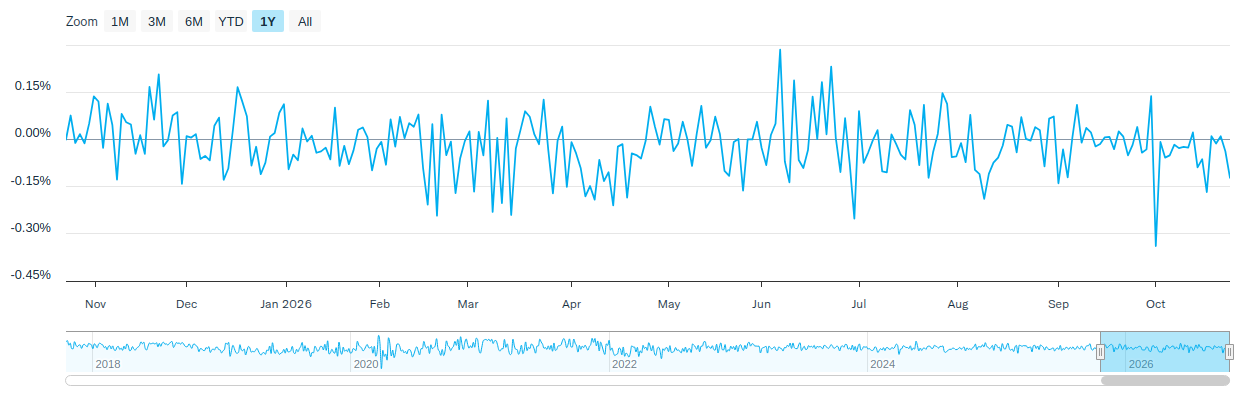
| 2025 | Q1 2026 | Q2 2026 | Q3 2026 | Q4 2026 | |
|---|---|---|---|---|---|
| Days Traded at Premium | 119 | 25 | 24 | 28 | - |
| Days Traded at NAV | 2 | 0 | 0 | 0 | - |
| Days Traded at Discount | 130 | 36 | 38 | 36 | - |
The table and line graph are provided to show the frequency at which the closing price of the Fund was at a premium (above) or discount (below) to the Fund’s daily net asset value (“NAV”). The table and line graph represent past performance and cannot be used to predict future results. Shareholders may pay more than NAV when buying Fund shares and receive less than an NAV when those shares are sold because shares are bought and sold at current market prices.
Literature
Fund Resources
Insights
BNAV Commentary 3Q 2026
October 16, 2026
Bitcoin: a technical take, divergence from Tech, and year-end tax considerations.
International Insights: Investing Across the Globe - September 2026
October 13, 2026
Audio Commentary by Tim Seymour, IDVO Portfolio Manager
Why Top 10 ETFs? Small Group. Big Impact. ETF Watch
September 22, 2026
Focused exposure to leading companies across quantum computing, space, robotics, and Asia memory semiconductors.
How to Invest
Amplify ETFs trade throughout the day, similar to publicly-traded stocks, on an exchange. There are multiple ways to invest in Amplify ETFs:
- Contact a Financial Advisor to discover how Amplify ETFs may fit within your portfolio.
- Amplify ETFs are available through various online platforms and brokerage accounts.
Connect with your ETF Specialist or call (855) 267-3837
Investing involves risk, including the possible loss of principal. Shares of any ETF are bought and sold at market price (not NAV), may trade at a discount or premium to NAV and are not individually redeemed from the Fund. Brokerage commissions will reduce returns. Narrowly focused investments typically exhibit higher volatility. The equity securities held in the Fund’s portfolio may experience sudden, unpredictable drops in value or long periods of decline in value. This may occur because of factors that affect securities markets generally or factors affecting specific issuers, industries, or sectors in which the Fund invests such as political, market and economic developments, as well as events that impact specific issuers. The Fund’s Index invests in companies that are derived from a SPAC. These companies may be unseasoned and lack a trading history, a track record of reporting to investors, and widely available research coverage. Smaller companies may be more vulnerable to adverse business or economic events than larger, more established companies, and may underperform other segments of the market or the equity market as a whole.
Amplify Investments LLC is the Investment Adviser to the Fund, and Tidal Investments, LLC serves as the Investment Sub-Adviser.
Amplify ETFs are distributed by Foreside Fund Services, LLC.