
Overview
Why Invest in COWS ETF?
- High Free Cash Flow Meets Dividend Growth: Strategy is focused on high free cash flow (FCF) companies that pay and have historically grown dividends.
- Beyond the Rearview Mirror: Using a quantitative selection process that combines trailing and forward free cash flow metrics delivers a portfolio that balances past and forecasted cash flow potential.
- Diversification & Risk control: Strategy seeks an equal weight portfolio with an industry exposure cap of 24% to both diversify and limit company and industry-specific risks.
Objective & Strategy
COWS is a strategy driven ETF investing in companies with a blend of high trailing and future free cash flow yields that have a history of growing and paying dividends. The portfolio aims to provide long-term capital appreciation and monthly income distributions. COWS seeks investment results that correspond generally to the Kelly US Cash Flow Dividend Leaders Index.
FCF is the remaining cash a company has after covering all expenses.
High FCF is one way to indicate the financial stability of a company.
Trailing FCF measures a company’s remaining cash over a past period of time.
Future FCF estimates a company’s future cash flows and ability to be profitable.
Key Information
Fund Details
Fees & Expenses
| Management Fee | 0.39% |
| Other Expenses | 0.00% |
| Total Annual Fund Operating Expenses | 0.39% |
| Expense Waiver/Reimbursement | (0.20%)iThe Fund's investment adviser has agreed to waive the management fees so the Fund’s net expense ratio will not exceed 0.19% of AUM, for assets up to $100 million until at least January 28, 2027. |
| Net Expense Ratio | 0.19%iAs of most recent prospectus |
Index Details
| Index Name | Kelly US Cash Flow Dividend Leaders Index |
| Index Ticker | COWSETF |
| Index Provider | Kelly Indexes, LLC |
| Weighting Methodology | Modified Equal Weight |
| Rebalance Frequency | Quarterly |
| Index Website | kellyintel.com |
Selection Methodology
Starting Universe
The 800 most liquid US listed companies tracked by the Syntax 1000 Index.
Trailing & Forward Free Cash Flow Yield Filter
Select the 200 highest free cash flow yield stocks as measured by equally weighting trailing & forward free cash flow yield for each stock.
Dividend Growth Filter
Filter for dividend paying stocks that also have three years of uninterrupted annual dividend growth.
Quality Screen
Eliminate any stocks with a payout ratio greater than 75% or in the top 10% of dividend yield of the remaining universe.
Final Portfolio
A modified equal-weight portfolio of 40 to 50 stocks.
The Syntax US 1000 Index is a broad-based US equity index that tracks the top 1000 companies within the Syntax US 3000 Index, excluding companies in the financials sector as determined by Syntax LLC.
Performance & Holdings
Performance
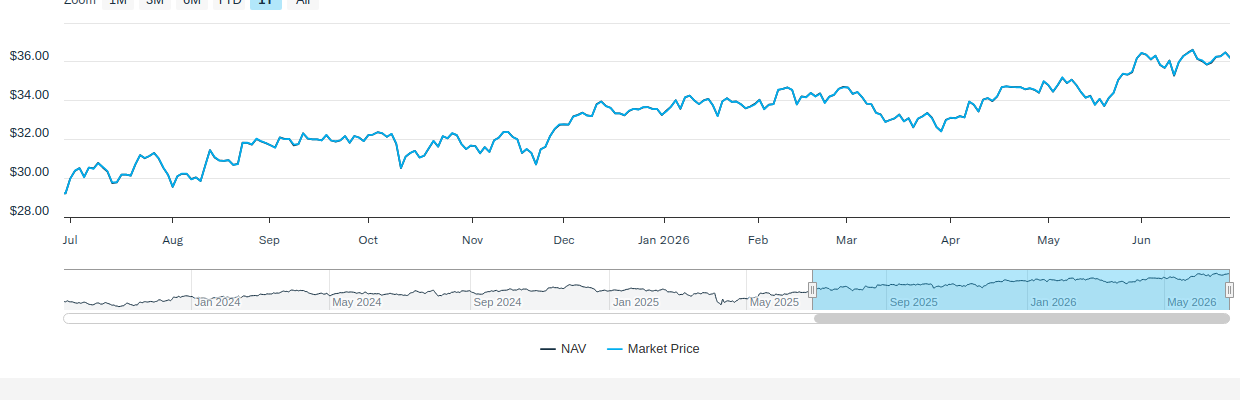
The performance data quoted represents past performance and does not guarantee future results. Investment return and principal value of an investment will fluctuate so that an investor’s shares, when sold or redeemed, may be worth more or less than the original cost. Current performance may be lower or higher than the performance quoted. Brokerage commissions will reduce returns. NAV is the sum of all its assets less any liabilities, divided by the number of shares outstanding. The closing price is the last price at which the fund traded.
Indexes are unmanaged and it’s not possible to invest directly in an index. The COWSETF Index is comprised of at least 40 and up to 100 mid- to large-capitalization publicly traded equity securities of US companies exhibiting characteristics of high free cash flow and consistent dividend growth. The S&P 500 Total Return Index is a market-capitalization-weighted index of the 500 largest U.S. publicly traded companies.
Top 10 Holdings
Fund holdings are subject to change at any time and should not be considered recommendations to buy or sell any security.
Allocation

Distributions
There is no guarantee that distributions will be made. Distributions may include income, capital gains, or return of capital and may vary during the year, details in the Fund’s Form 19a‑1.
Price
NAV/Market Price
Daily Price/NAV Performance
Premium/Discount
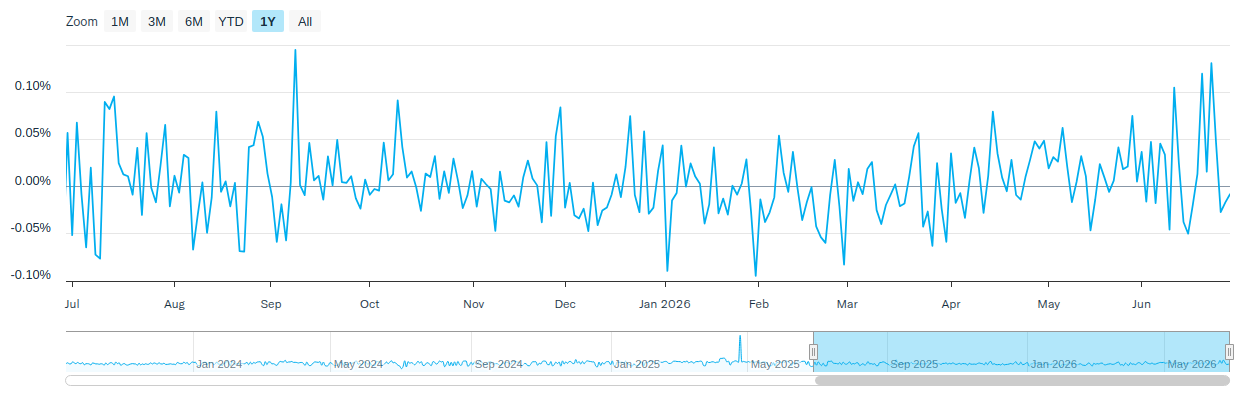
The table and line graph are provided to show the frequency at which the closing price of the Fund was at a premium (above) or discount (below) to the Fund’s daily net asset value (“NAV”). The table and line graph represent past performance and cannot be used to predict future results. Shareholders may pay more than NAV when buying Fund shares and receive less than an NAV when those shares are sold because shares are bought and sold at current market prices.
Literature
Fund Resources
Insights
Six for ’26: From Signals to Strategies
December 22, 2025
2026 Investment Outlook
2025 Investment Outlook: Six Themes to Consider
January 10, 2025
Key considerations in cryptocurrencies, artificial intelligence and thematic trends, market breadth, income diversification, scarce resources, and volatility management. In 2024 geopolitical tensions around the globe unnerved investors and dominated headlines throughout the year, yet U.S. equi[...]
Navigating Election Uncertainty: 3 Investment Trends Poised to Defy Political Tides
October 3, 2024
Exploring diverse investment opportunities regardless of election outcomes. The November election is in its final stretch, and recently, we discussed the trends that have historically shaped markets leading up to the election. Many investors are already asking what the implications of [...]
How to Invest
Amplify ETFs trade throughout the day, similar to publicly-traded stocks, on an exchange. There are multiple ways to invest in Amplify ETFs:
- Contact a Financial Advisor to discover how Amplify ETFs may fit within your portfolio.
- Amplify ETFs are available through various online platforms and brokerage accounts.
Connect with your ETF Specialst or call (855) 267-3837
Investing involves risk, including the possible loss of principal. The fund is new with limited operating history. You could lose money by investing in the Fund. Shares of any ETF are bought and sold at market price (not NAV), may trade at a discount or premium to NAV and are not individually redeemed from the Fund. There can be no assurance that the Fund’s investment objectives will be achieved. Brokerage commissions will reduce returns. Although the Shares are listed for trading on the Exchange, there can be no assurance that an active trading market for the Shares will develop or be maintained.
The value of the Shares will fluctuate with changes in the value of the equity securities in which it invests. Because the Fund is non-diversified and can invest a greater portion of its assets in securities of individual issuers than a diversified fund, changes in the market value of a single investment could cause greater fluctuations in Share price than would occur in a diversified fund. Diversification does not assure a profit or protect against a loss in a declining market. The Fund is susceptible to operational risks through breaches in cyber security. Small and/or mid-capitalization companies may be more vulnerable to adverse general market or economic developments.
There is no guarantee that a company will pay or continually increase its dividends. The Fund intends to estimate annual income and pay in monthly installments. In doing so, some portion of the distribution could be considered a return of capital for tax purposes.
The Fund employs a “passive management” or indexing investment approach that seeks investment results that correspond (before fees and expenses) generally to the performance of its underlying index. Differences in timing of trades and valuation as well as fees and expenses, may cause the fund to not exactly replicate the index known as tracking error.
Amplify Investments LLC serves as the investment adviser to the Fund. Kelly Strategic Management, LLC and Penserra Capital Management LLC each serve as investment sub-advisers to the Fund.
Amplify ETFs are distributed by Foreside Fund Services, LLC.