Three Strategies. Three Markets.
One Established Approach to Growth and Income.
Amplify CWP Enhanced Dividend Income ETF (DIVO), Amplify CWP International Enhanced Dividend Income ETF (IDVO) and Amplify CWP Growth & Income ETF share a common DNA: each is actively managed, built on a tactical covered call strategy, and designed to deliver three sources of total return:

Capital Appreciation
from carefully selected
equity holdings.

Dividend Income
from high-quality
dividend-paying stocks.

Option Premium Income
from selling covered call
options to generate income.
While they share this framework, each fund targets a different slice of the market—U.S. blue chips (DIVO), international developed markets (IDVO), and U.S. growth leaders (QDVO)—allowing investors to diversify exposure and income streams across geographies and styles.
Part of Amplify YieldSmartTM ETFs covered call suite – which seeks to balance income and capital appreciation by using carefully crafted options strategies.
Covered Calls Explained
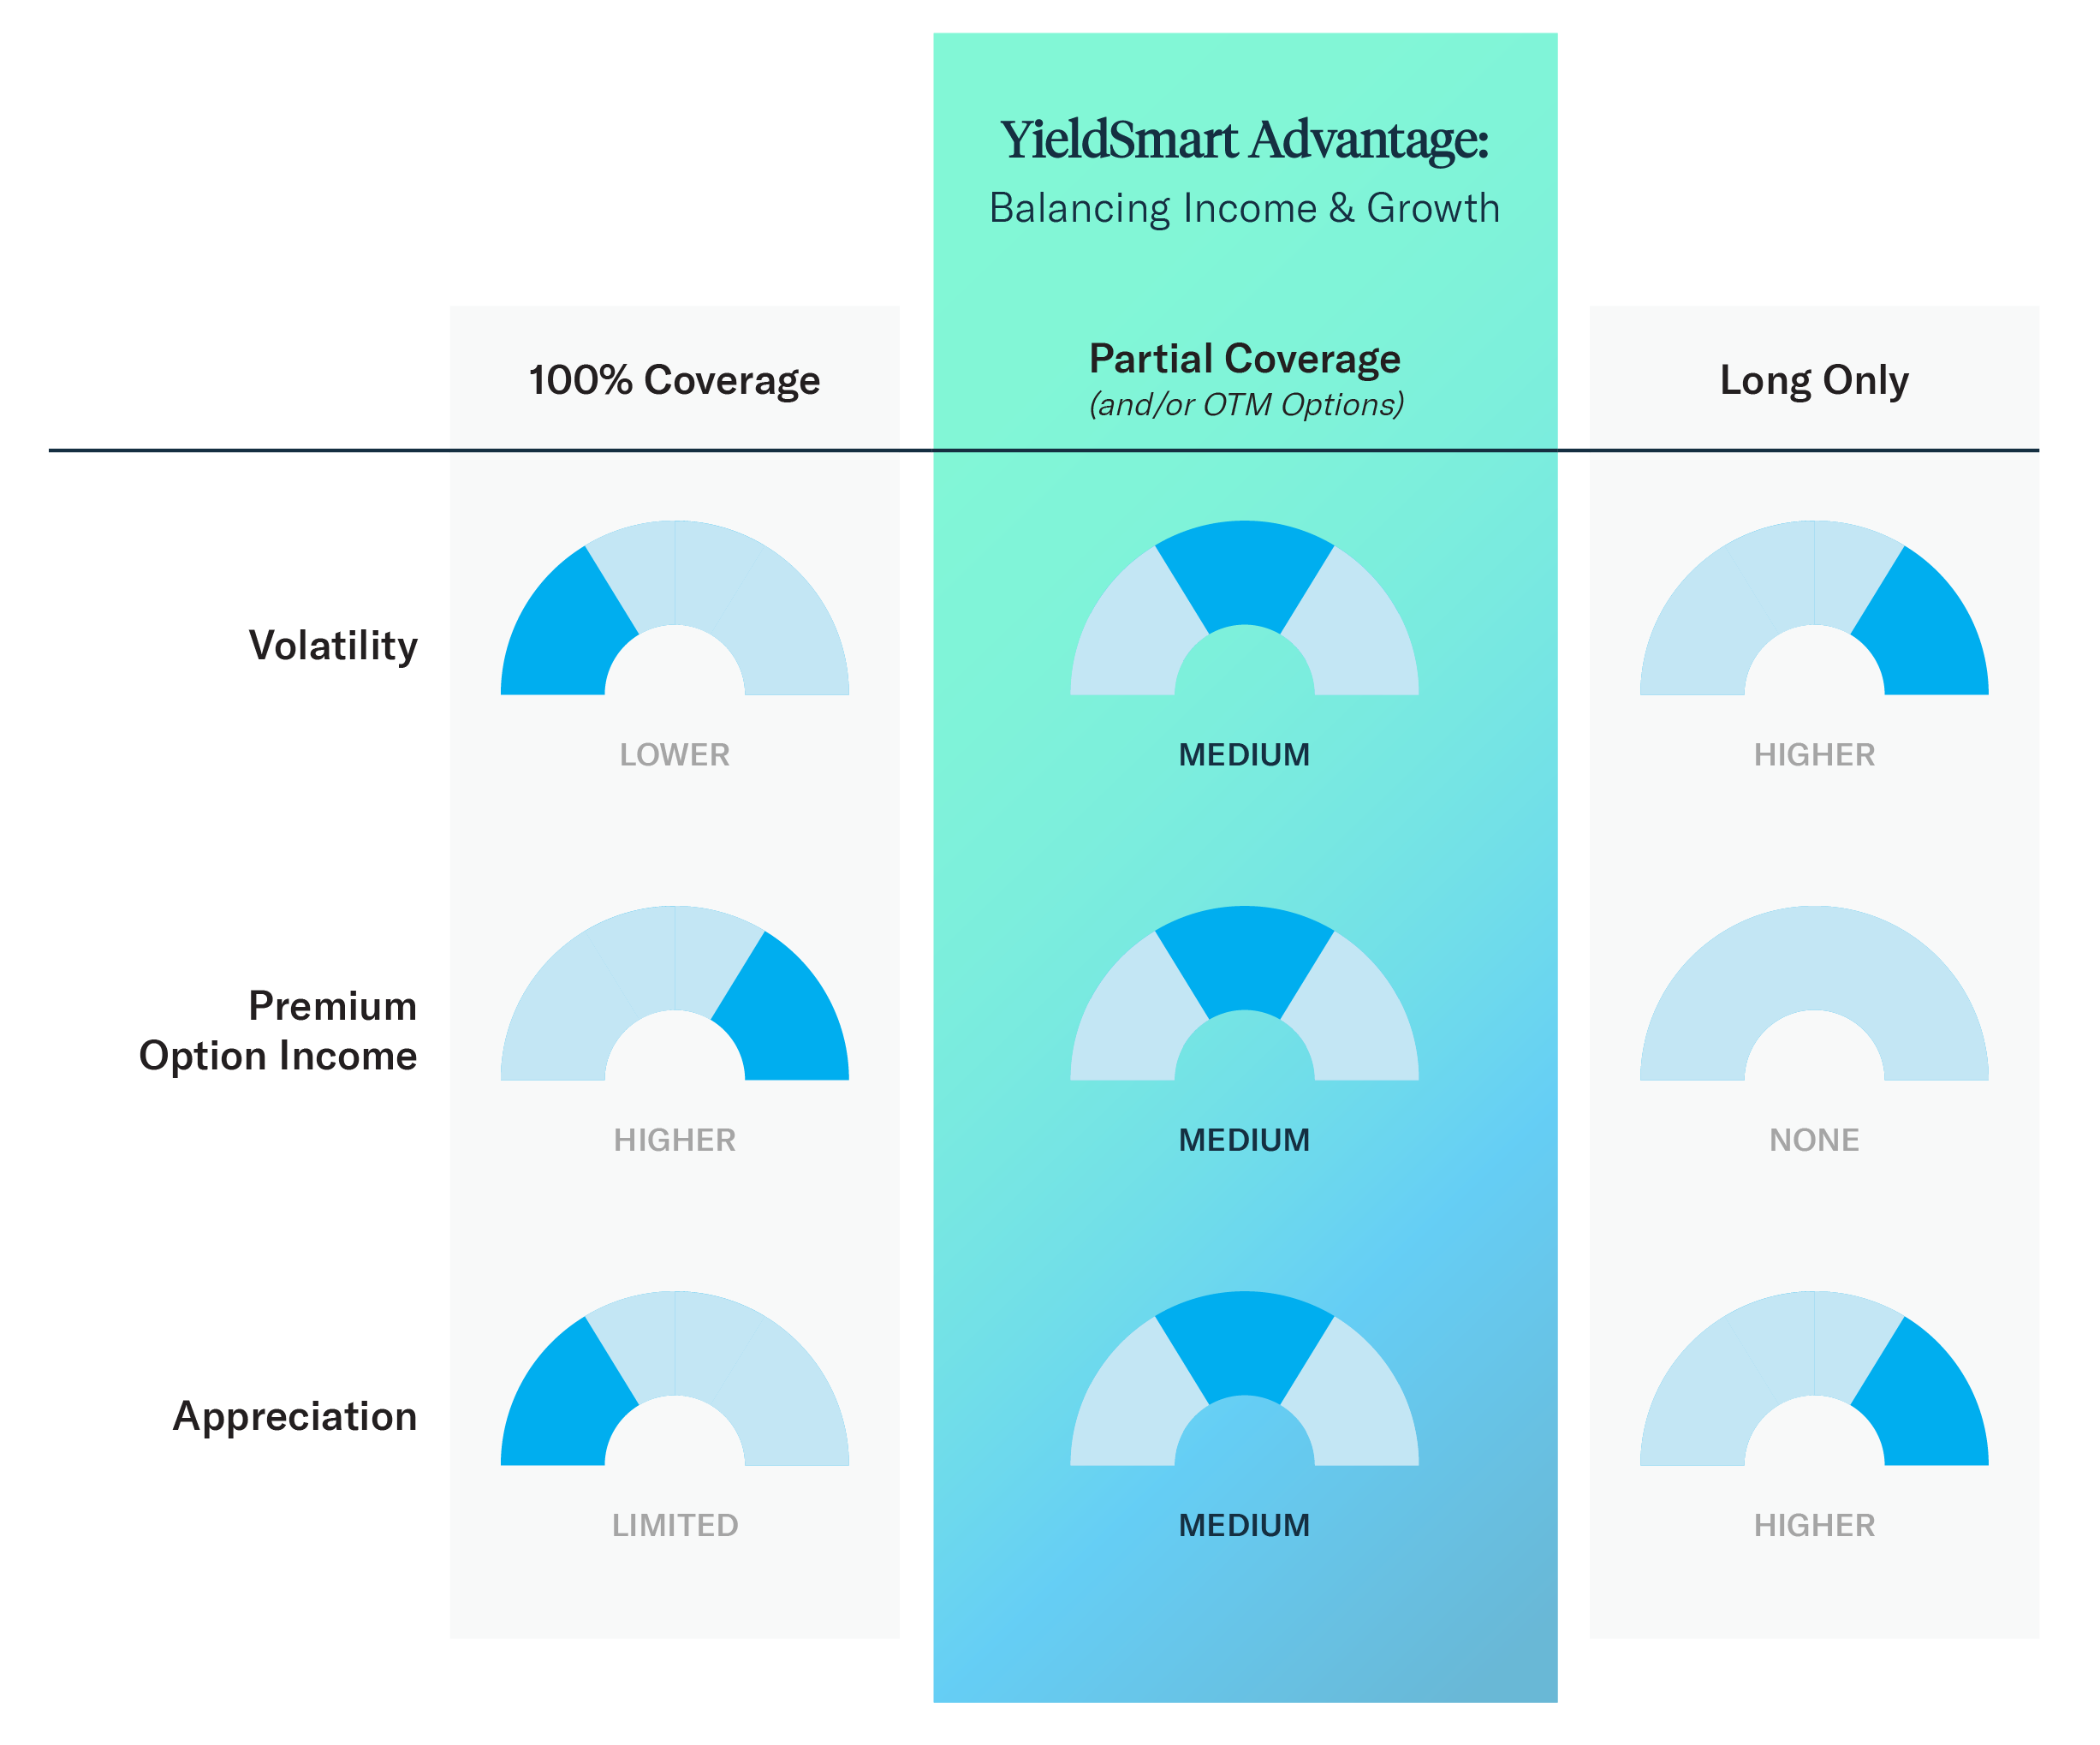
Partial Coverage for Growth Potential
Unlike 100% covered call portfolios that forfeit all upside potential, DIVO, IDVO, and QDVO use partial coverage—writing calls on only a portion of the portfolio.
Why partial coverage matters:
Generates consistent income potential from option premiums.
Leaves a portion of the portfolio uncovered to participate in market rallies.
Reduces volatility via income compared to a fully uncovered portfolio.
What is a covered call?
A covered call is an options strategy where the investor owns a security and sells a call option on it to receive premium income. This premium enhances income but potentially limits upside if the stock rises above the strike price.
All three ETFs employ covered call writing—selling call options on stocks they already own. This generates income while potentially capping upside if the stock price rises above the strike price. These ETFs write opportunistic covered calls on individual equities.
Option "Moneyness" Spectrum
- OTM (Out-of-the-Money): Lower premium, higher appreciation potential.
- ATM (At-the-Money): Balanced premium and growth potential.
- ITM (In-the-Money): Highest premium, lowest growth potential.
Market Focus and Differentiation
| FUND | MARKET FOCUS | STYLE TILT | COVERAGE RANGE |
DISTRIBUTION FREQUENCY |
30-DAY SEC YIELD** |
DISTRIBUTION RATE* |
|---|---|---|---|---|---|---|
| DIVO | U.S. large-cap dividend leaders | Quality/Value | 20-30% | Monthly | TBD | TBD |
| IDVO | International developed markets | Dividend/Value | 30-60% | Monthly | TBD | TBD |
| QDVO | U.S. growth-oriented equities | Growth/Momentum | 30-50% | Monthly | TBD | TBD |
There is no guarantee distributions will be made. Distribution Rate is the normalized current distribution (annualized) over NAV per share. In addition to net interest income, distribution on 9/30/2025 included an estimated return of capital, 69% (DIVO); 99% (IDVO); 96% (QDVO). See Forms 19a-1.
30-Day SEC Yield is a standard yield calculation developed by the Securities and Exchange Commission that allows for fairer comparisons among bond funds. It is based on the most recent month end. This figure reflects the income earned from dividends – excluding option income – during the period after deducting the Fund’s expenses for the period.
By combining three sources of total return, pursuing tax-efficient return of capital distributions, and a partial OTM coverage approach, DIVO, IDVO, and QDVO seek to offer:

Attractive monthly income potential.

Upside participation
in rising markets.

Reduced volatility versus fully uncovered equity portfolios.

Diversification across U.S. value, international value, and U.S. growth segments.

Tax Efficient Income opportunities.
These ETFs are designed for investors who want to stay invested in equities, generate consistent income, and manage risk—without giving up all the growth potential.
DIVO Performance
| CUMULATIVE (%) | ANNUALIZED (%) | ||||||||
|---|---|---|---|---|---|---|---|---|---|
| 1 Mo. | 3 Mo. | 6 Mo. | YTD | Since Inception | 1 Yr. | 3 Yr. | 5 Yr. | Since Inception | |
| Month end as of TBD | |||||||||
| NAV | N/A | N/A | N/A | N/A | N/A | N/A | N/A | N/A | N/A |
| Closing Price | N/A | N/A | N/A | N/A | N/A | N/A | N/A | N/A | N/A |
| S&P 500 TR Index | N/A | N/A | N/A | N/A | N/A | N/A | N/A | N/A | N/A |
| Cboe S&P 500 BuyWrite Index | N/A | N/A | N/A | N/A | N/A | N/A | N/A | N/A | N/A |
| Quarter end as of TBD | |||||||||
| NAV | N/A | N/A | N/A | N/A | N/A | N/A | N/A | N/A | N/A |
| Closing Price | N/A | N/A | N/A | N/A | N/A | N/A | N/A | N/A | N/A |
| S&P 500 TR Index | N/A | N/A | N/A | N/A | N/A | N/A | N/A | N/A | N/A |
| Cboe S&P 500 BuyWrite Index | N/A | N/A | N/A | N/A | N/A | N/A | N/A | N/A | N/A |
Fund inception date: 12/13/2016. Expense Ratio: 0.56%. The performance data quoted represents past performance and does not guarantee future results. Investment return and principal value of an investment will fluctuate so that an investor’s shares, when sold or redeemed, may be worth more or less than the original cost. Current performance may be lower or higher than the performance quoted. Brokerage commissions will reduce returns. NAV is the sum of all its assets less any liabilities, divided by the number of shares outstanding. The closing price is the last price at which the fund traded.
Indexes are unmanaged and it’s not possible to invest directly in an index. The S&P 500 Total Return Index is a market-cap-weighted index of the 500 largest U.S. publicly traded companies. The Cboe BuyWrite Index (BXM) tracks the performance of a hypothetical buy-write strategy on the S&P 500 Index. DIVO differs substantially from the S&P 500 and BXM indexes, which are used for comparison purposes as widely recognized measure of U.S. stock market performance.
IDVO Performance
| CUMULATIVE (%) | ANNUALIZED (%) | ||||||||
|---|---|---|---|---|---|---|---|---|---|
| 1 Mo. | 3 Mo. | 6 Mo. | YTD | Since Inception | 1 Yr. | 3 Yr. | 5 Yr. | Since Inception | |
| Month end as of TBD | |||||||||
| NAV | N/A | N/A | N/A | N/A | N/A | N/A | N/A | N/A | N/A |
| Closing Price | N/A | N/A | N/A | N/A | N/A | N/A | N/A | N/A | N/A |
| MSCI ACWI ex USA Index | N/A | N/A | N/A | N/A | N/A | N/A | N/A | N/A | N/A |
| Quarter end as of TBD | |||||||||
| NAV | N/A | N/A | N/A | N/A | N/A | N/A | N/A | N/A | N/A |
| Closing Price | N/A | N/A | N/A | N/A | N/A | N/A | N/A | N/A | N/A |
| MSCI ACWI ex USA Index | N/A | N/A | N/A | N/A | N/A | N/A | N/A | N/A | N/A |
Fund inception date: 09/08/2022. Expense Ratio: 0.66%. The performance data quoted represents past performance and does not guarantee future results. Investment return and principal value of an investment will fluctuate so that an investor’s shares, when sold or redeemed, may be worth more or less than the original cost. Current performance may be lower or higher than the performance quoted. Brokerage commissions will reduce returns. NAV is the sum of all its assets less any liabilities, divided by the number of shares outstanding. The closing price is the last price at which the fund traded.
QDVO Performance
| CUMULATIVE (%) | ANNUALIZED (%) | ||||||||
|---|---|---|---|---|---|---|---|---|---|
| 1 Mo. | 3 Mo. | 6 Mo. | YTD | Since Inception | 1 Yr. | 3 Yr. | 5 Yr. | Since Inception | |
| Month end as of TBD | |||||||||
| NAV | N/A | N/A | N/A | N/A | N/A | N/A | N/A | N/A | N/A |
| Closing Price | N/A | N/A | N/A | N/A | N/A | N/A | N/A | N/A | N/A |
| S&P 500 Growth Index | N/A | N/A | N/A | N/A | N/A | N/A | N/A | N/A | N/A |
| Quarter end as of TBD | |||||||||
| NAV | N/A | N/A | N/A | N/A | N/A | N/A | N/A | N/A | N/A |
| Closing Price | N/A | N/A | N/A | N/A | N/A | N/A | N/A | N/A | N/A |
| S&P 500 Growth Index | N/A | N/A | N/A | N/A | N/A | N/A | N/A | N/A | N/A |
Fund inception date: 08/22/2024. Expense Ratio: 0.55%. The performance data quoted represents past performance and does not guarantee future results. Investment return and principal value of an investment will fluctuate so that an investor’s shares, when sold or redeemed, may be worth more or less than the original cost. Current performance may be lower or higher than the performance quoted. Brokerage commissions will reduce returns. NAV is the sum of all its assets less any liabilities, divided by the number of shares outstanding. The closing price is the last price at which the fund traded.

Amplify CWP Enhanced Dividend Income ETF

Amplify CWP International Enhanced Dividend Income ETF

Covered call risk is the risk that the Fund will forgo, during the option’s life, the opportunity to profit from increases in the market value of the security covering the call option above the sum of the premium and the strike price of the call, but has retained the risk of loss should the price of the underlying security decline.
Distributions classified as return of capital, which may include option premiums, dividends, capital gains, and interest, reduce an investor’s cost basis in Fund shares. This can result in higher future taxes upon sale, even if shares are sold at a loss relative to the original investment.
This information does not constitute, and should not be considered a substitute for any specific legal, tax or accounting advice. Please consult with qualified professionals for this type of advice.
Distributed by Foreside Fund Services, LLC