
| 5.94% |
| Distribution Rate i Distribution Rate is the normalized current distribution (annualized) over NAV per share. Distributions may include return of capital (ROC). Click on "All Distributions→" to view Form 19a-1. |
| 1.46% |
| 30-Day SEC Yield i 30-Day SEC Yield is a standard yield calculation developed by the Securities and Exchange Commission that allows for fairer comparisons among bond funds. It is based on the most recent month end. This figure reflects the income earned from dividends – excluding option income – during the period after deducting the Fund’s expenses for the period. |
| Monthly |
| Distribution Frequency |
Overview
★★★★★
Overall Morningstar RatingTM
Based on risk adjusted returns among 85 funds in the Derivative Income category (as of 6/30/26).
Why Invest in IDVO ETF?
- Two Potential Income Streams: IDVO seeks to provide income from international dividend-paying stocks and by opportunistically writing covered calls on those stocks.
- Seeks to Lower Volatility: Dividend and option income reduce share price volatility versus the overall market during times of broad-based market declines.
- Professionally Managed: Access a professionally managed dividend and option income international investment strategy through the efficiency of an ETF.
Objective & Strategy
IDVO is an ETF of high-quality international large and mid-cap companies through American Depositary Receipts (ADRs) with a history of dividend and earnings growth, along with a tactical covered call strategy on individual securities. Capital Wealth Planning LLC (CWP) and Seymour Asset Management LLC serve as investment sub-advisers to the Fund.


Why International?
Historically, foreign companies can provide diversification if added to US-only portfolios. In many cases, these companies offer the potential for faster growth than typical domestic companies. Additionally, writing covered calls on these foreign stocks have historically provided higher premiums.
YieldSmart™ ETFs
Key Information
Fund Details
| Ticker | IDVO |
| Launch Date | 09/08/2022 |
| Primary Exchange | NYSE Arca |
| CUSIP | 032108722 |
| Net Assets | $1,309,893,311 |
| Shares Outstanding | 31,275,000 |
| Holdings (view all holdings) | 78 |
| Total Expense Ratio i | 0.65% |
Portfolio Management
Selection Methodology
Dividend Growers
Identifying ADRs of high-quality large-cap companies from the MSCI ACWI ex USA Index that we believe will, over time, sustain their earnings and cash flow growth, and increase their annual dividends consistently.
Sector Allocation
The portfolio managers consider which industry sectors or countries appear to be outperforming relative to the overall market and over-weights those sectors or countries by selecting that are outperforming relative to their peers.
Security Selection
Assembling a portfolio of 30-50 securities that have been screened according to attributes such as earnings, cash flow, return on equity, market capitalization, and management track.
Tactical Covered Call Writing
Tactical covered-call writing on individual securities to lower risk and enhance total return. Fund seeks to provide gross income of approximately 3-4% from dividend income and 2-4% from sold call options.
Performance & Holdings
Performance
| Cumulative (%) | Annualized (%) | |||||||||
|---|---|---|---|---|---|---|---|---|---|---|
| 1MO | 3MO | 6MO | YTD | Since Inception | 1YR | 3YR | 5YR | 10YR | Since Inception | |
| NAV | -0.56% | 5.46% | 12.92% | 12.92% | 111.16% | 29.75% | 21.88% | — | — | 21.67% |
| Closing Price | -0.55% | 5.34% | 12.87% | 12.87% | 111.32% | 29.81% | 21.89% | — | — | 21.69% |
| MSCI ACWI ex USA Index | -0.59% | 14.49% | 13.68% | 13.68% | 95.01% | 27.66% | 18.82% | — | — | 19.15% |
The performance data quoted represents past performance and does not guarantee future results. Investment return and principal value of an investment will fluctuate so that an investor’s shares, when sold or redeemed, may be worth more or less than the original cost. Current performance may be lower or higher than the performance quoted. Brokerage commissions will reduce returns. NAV is the sum of all its assets less any liabilities, divided by the number of shares outstanding. The closing price is the last price at which the fund traded.
Indexes are unmanaged and it’s not possible to invest directly in an index. The MSCI ACWI ex USA Index is a free float-adjusted market-cap-weighted index designed to measure the combined equity performance of developed and emerging market countries, excluding the United States.
Top 10 Holdings
| Name | Ticker | Market Value (%) | CUSIP | Shares | Market Value ($) |
|---|---|---|---|---|---|
| Taiwan Semiconductor Manufacturing Co Ltd | TSM | 4.69% | 874039100 | 154,197 | $61,427,459 |
| Bank of Montreal | BMO | 3.63% | 063671101 | 261,564 | $47,596,801 |
| Mitsubishi UFJ Financial Group Inc | MUFG | 3.40% | 606822104 | 2,089,211 | $44,541,979 |
| Sumitomo Mitsui Financial Group Inc | SMFG | 3.21% | 86562M209 | 1,684,190 | $42,020,541 |
| ASML Holding NV | ASML | 3.07% | N07059210 | 23,019 | $40,227,544 |
| America Movil SAB de CV | AMX | 3.04% | 02390A101 | 1,515,162 | $39,803,306 |
| Siemens AG | SIEGY | 2.92% | 826197501 | 252,062 | $38,202,517 |
| British American Tobacco PLC | BTI | 2.83% | 110448107 | 589,652 | $37,053,732 |
| Vodafone Group PLC | VOD | 2.81% | 92857W308 | 2,341,636 | $36,857,351 |
| Fomento Economico Mexicano SAB de CV | FMX | 2.59% | 344419106 | 262,994 | $33,931,486 |
Fund holdings are subject to change at any time and should not be considered recommendations to buy or sell any security.
Allocation

| Sector Allocation | Weight (%) |
|---|---|
| Financials | 22.42% |
| Materials | 13.09% |
| Energy | 12.84% |
| Information Technology | 11.37% |
| Communication Services | 10.86% |
| Consumer Staples | 9.74% |
| Health Care | 7.52% |
| Industrials | 6.83% |
| Utilities | 3.16% |
| Consumer Discretionary | 2.17% |
| Country Allocation | Weight (%) |
|---|---|
| Canada | 16.95% |
| United Kingdom | 13.92% |
| Taiwan | 7.87% |
| Mexico | 6.93% |
| Japan | 6.57% |
| Argentina | 4.70% |
| Brazil | 4.47% |
| Spain | 4.01% |
| Germany | 3.92% |
| China | 3.75% |
| Netherlands | 3.50% |
| Italy | 2.78% |
| Israel | 2.72% |
| Luxembourg | 2.67% |
| United States | 2.62% |
| Hong Kong | 2.17% |
| Belgium | 2.12% |
| Korea | 1.99% |
| Switzerland | 1.95% |
| Other | 4.39% |
Distributions & Yields
Distributions
| Ex-Date | Record Date | Payable Date | Amount (USD) |
|---|---|---|---|
| 01/29/2026 | 01/29/2026 | 01/30/2026 | $0.21500 |
| 02/26/2026 | 02/26/2026 | 02/27/2026 | $0.21710 |
| 03/30/2026 | 03/30/2026 | 03/31/2026 | $0.20619 |
| 04/29/2026 | 04/29/2026 | 04/30/2026 | $0.21080 |
| 05/28/2026 | 05/28/2026 | 05/29/2026 | $0.21470 |
| 06/29/2026 | 06/29/2026 | 06/30/2026 | $0.20775 |
| 07/30/2026 | 07/30/2026 | 07/31/2026 | — |
| 08/28/2026 | 08/28/2026 | 08/31/2026 | — |
| 09/29/2026 | 09/29/2026 | 09/30/2026 | — |
| 10/29/2026 | 10/29/2026 | 10/30/2026 | — |
| 11/27/2026 | 11/27/2026 | 11/30/2026 | — |
| 12/30/2026 | 12/30/2026 | 12/31/2026 | — |
Yields
| Distribution Rate | 5.94% | 30-Day SEC Yield | 1.46% |
| Distribution Frequency | Monthly |
There is no guarantee that distributions will be made. Distributions may include income, capital gains, or return of capital and may vary during the year, details in the Fund’s Form 19a‑1.
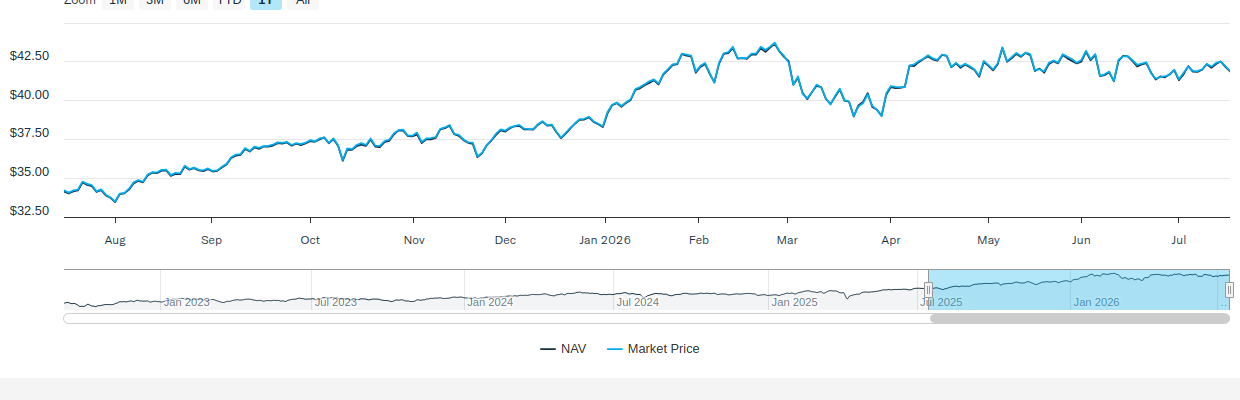
Price
NAV/Market Price
| Previous Day's NAV | |
|---|---|
| Net Asset Value: | $41.88 |
| Daily Change: | $-0.29 |
| % Daily Change: | -0.69% |
| 30-Day Median Bid/Ask Spread: | 0.17% |
| Previous Day's Market Price | |
|---|---|
| Closing Price: | $41.91 |
| Daily Change: | $-0.31 |
| % Daily Change: | -0.73% |
| % Premium/Discount: | 0.06% |
Daily Price/NAV Performance
Premium/Discount
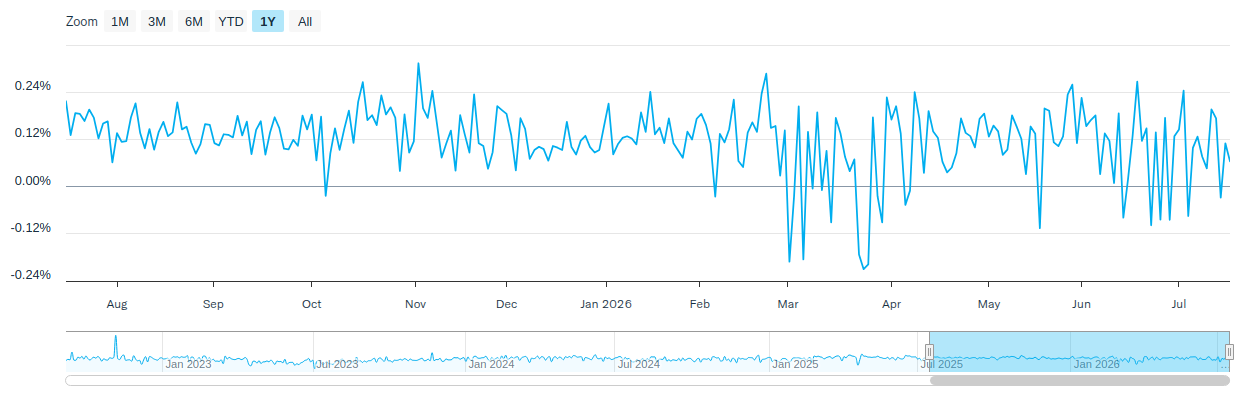
| 2025 | Q1 2026 | Q2 2026 | Q3 2026 | Q4 2026 | |
|---|---|---|---|---|---|
| Days Traded at Premium | 235 | 49 | 55 | - | - |
| Days Traded at NAV | 0 | 0 | 0 | - | - |
| Days Traded at Discount | 16 | 12 | 7 | - | - |
The table and line graph are provided to show the frequency at which the closing price of the Fund was at a premium (above) or discount (below) to the Fund’s daily net asset value (“NAV”). The table and line graph represent past performance and cannot be used to predict future results. Shareholders may pay more than NAV when buying Fund shares and receive less than an NAV when those shares are sold because shares are bought and sold at current market prices.
Literature
Fund Resources
Insights
International Insights: Investing Across the Globe - May 2026
June 8, 2026
Audio Commentary by Tim Seymour, IDVO Portfolio Manager
International Insights: Investing Across the Globe - April 2026
May 7, 2026
Audio Commentary by Tim Seymour, IDVO Portfolio Manager
International Insights: Investing Across the Globe - March 2026
April 24, 2026
Audio Commentary by Tim Seymour, IDVO Portfolio Manager
How to Invest
Amplify ETFs trade throughout the day, similar to publicly-traded stocks, on an exchange. There are multiple ways to invest in Amplify ETFs:
- Contact a Financial Advisor to discover how Amplify ETFs may fit within your portfolio.
- Amplify ETFs are available through various online platforms and brokerage accounts.
Connect with your ETF Specialist or call (855) 267-3837
*A covered call refers to a financial transaction in which the investor selling call options owns an equivalent amount of the underlying security.
Investing involves risk, including the possible loss of principal. You could lose money by investing in the Fund. Shares of any ETF are bought and sold at market price (not NAV), may trade at a discount or premium to NAV and are not individually redeemed from the Fund. Brokerage commissions will reduce returns. An investment in the Fund is not a deposit of a bank and is not insured or guaranteed by the Federal Deposit Insurance Corporation or any other governmental agency. There can be no assurance that the Fund’s investment objectives will be achieved. The Fund is subject to management risk because it is actively managed. Covered call risk is the risk that the Fund will forgo, during the option’s life, the opportunity to profit from increases in the market value of the security covering the call option above the sum of the premium and the strike price of the call, but has retained the risk of loss should the price of the underlying security decline. Investments in foreign securities involve greater volatility and political, economic, and currency risks and differences in accounting methods. Investments in emerging market issuers are subject to a greater risk of loss than investments in issuers located or operating in more developed markets. There is no guarantee that a company will pay or continually increase its dividends. The Fund intends to estimate annual income and pay in monthly installments. In doing so, some portion of the distribution could be considered a return of capital for tax purposes.
Because the Fund is non-diversified and can invest a greater portion of its assets in securities of individual issuers than a diversified fund, changes in the market value of a single investment could cause greater fluctuations in Share price than would occur in a diversified fund.
© 2026 Morningstar, Inc. All rights reserved. The information contained herein: (1) is proprietary to Morningstar and/or its content providers; (2) may not be copied or distributed; and (3) is not warranted to be accurate, complete, or timely. Neither Morningstar nor its content providers are responsible for any damages or losses arising from any use of this information. Past performance is no guarantee of future results.
The Morningstar Rating™ for funds, or “star rating”, is calculated for managed products (including mutual funds, variable annuity and variable life subaccounts, exchange-traded funds, closed-end funds, and separate accounts) with at least a three-year history. Exchange-traded funds and open-ended mutual funds are considered a single population for comparative purposes. It is calculated based on a Morningstar Risk-Adjusted Return measure that accounts for variation in a managed product’s monthly excess performance, placing more emphasis on downward variations and rewarding consistent performance. The Morningstar Rating does not include any adjustment for sales loads. The top 10% of products in each product category receive 5 stars, the next 22.5% receive 4 stars, the next 35% receive 3 stars, the next 22.5% receive 2 stars, and the bottom 10% receive 1 star. The Overall Morningstar Rating for a managed product is derived from a weighted average of the performance figures associated with its three-, five-, and 10-year (if applicable) Morningstar Rating metrics. The weights are: 100% three-year rating for 36-59 months of total returns, 60% five-year rating/40% three-year rating for 60-119 months of total returns, and 50% 10-year rating/30% five-year rating/20% three-year rating for 120 or more months of total returns. While the 10-year overall star rating formula seems to give the most weight to the 10-year period, the most recent three-year period actually has the greatest impact because it is included in all three rating periods. IDVO received 5 stars among 85 funds in the Derivative Income category for the overall and 3-year periods ending 6/30/26.
Amplify Investments LLC serves as the investment adviser to the Fund. Capital Wealth Planning, LLC, Penserra Capital Management LLC, and Seymour Asset Management LLC each serve as investment sub-advisers to the Fund.