
Fund Details
| Ticker | NDIV |
| Inception | 8/24/2022 |
| Primary Exchange | NYSE Arca |
| CUSIP | 032108730 |
| Net Assets | N/A |
| Shares Outstanding | N/A |
| # of Holdings (view all holdings) | N/A |
| Expense Ratio: | N/A |
Fund Characteristics
| Weighted Avg. Market Cap | N/A |
| Price-to-earnings | N/A |
| Price-to-book | N/A |
| Standard deviation | N/A |
Standard deviation measures how dispersed returns are around the average. A higher standard deviation indicates that returns are spread out over a larger range of values and thus, more volatile.
Index Details
| Index Name | VettaFi Energy and Natural Resources Covered Call Index |
| Index Ticker | NDIVY |
| Index Provider | VettaFi |
| Weighting | Modified, Dividend Weighting |
| Rebalance Frequency | Monthly |
| Index Website | vettafi.com |
Fund Documents
Three Reasons to Own NDIV:
- High Target Income + Growth: NDIV targets 10% or greater total annualized income by pairing high dividend energy & natural resource equities with covered call option income, while also pursuing capital appreciation to complete its three sources of total return.
- Rising Global Demand for Energy & Natural Resources: NDIV seeks price appreciation through investments in energy and natural resource companies. Rising demand from Al-driven energy use, U.S. reshoring, and global electrification is increasing the need for oil, natural gas, and key resources, creating opportunities for stronger cash flow and earnings.
- Inflation Hedge: NDIV invests in U.S.-listed equities, American depositary receipts (ADRs) or over-the-counter (OTC) listed shares of global natural resource and commodity-related companies, which may help provide an inflation hedge.
There is no guarantee the Fund will achieve the Target Option Premium in any period. Actual premium income over a year may be higher or lower depending on changes in the Fund’s NAV.
Based on risk adjusted returns among 119 funds in the Natural Resources category (as of 3/31/26).
A Unique Play on the Energy Transition
Objective and Strategy
NDIV is designed to balance high income and capital appreciation potential. NDIV targets 10% or greater annualized income from dividends and covered calls while providing exposure to energy and natural resource equities. NDIV seeks investment results that generally correspond to the price and yield of the VettaFi Energy and Natural Resources Covered Call Index.
NDIV Selection Methodology
NDIV seeks to pair high dividend energy and natural resource equities with the potential for covered call option income while also pursuing capital appreciation to round out its three sources of total return.
Targets 10% or Greater Total Annualized Income and Capital Appreciation
Identify
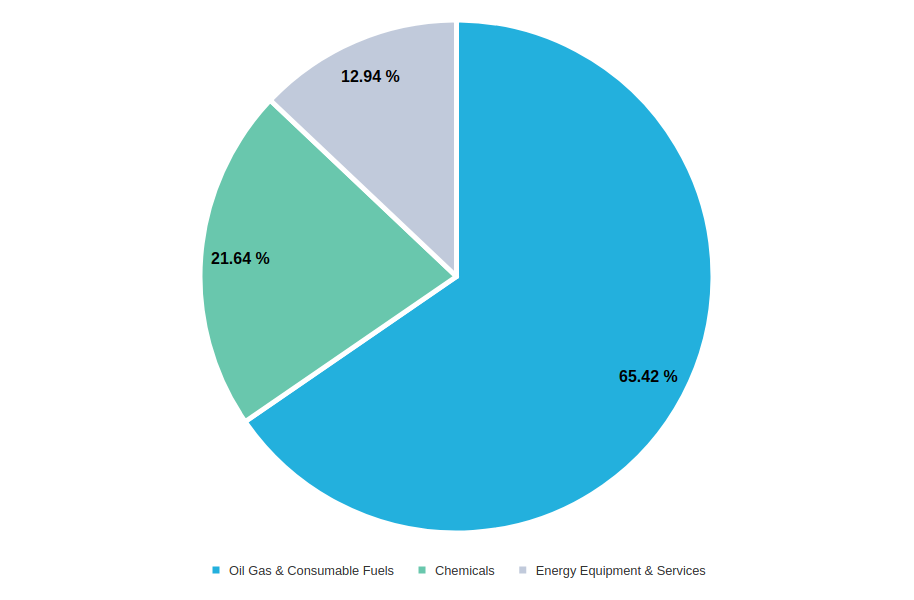
Index identifies dividend-paying U.S. exchange-listed equities that primarily operate in the energy (oil, gas, & consumable fuels) and natural resources‑related industries.
Companies are weighted according to dividend yield with a max weight of 5% at the time of rebalance.
Covered Call Strategy
Sell monthly call options to generate 6% annualized option premium.
Rebalance
Index rebalances monthly.
Yield & Distributions
| Distribution Rate* | N/A | 30-Day SEC Yield** | N/A | |
| Distribution Frequency | Monthly | |||
| EX-DATE | RECORD DATE | PAYABLE DATE | AMOUNT |
|---|---|---|---|
|
2022 |
|||
| 9/28/22 | 9/29/22 | 9/30/22 | $0.19602 |
| 12/28/22 | 12/29/22 | 12/30/22 | $0.19670 |
| 12/29/2022 | 12/30/2022 | 1/31/2023 | (Special Distribution) $0.04468 |
|
2023 |
|||
| 12/29/2022 | 12/30/2022 | 1/31/2023 | (Special Distribution)* $0.04468 |
| 2/24/23 | 2/27/23 | 2/28/23 | $0.14453 |
| 3/29/23 | 3/30/23 | 3/31/23 | $0.24540 |
| 4/26/23 | 4/27/23 | 4/28/23 | $0.21498 |
| 5/26/23 | 5/30/23 | 5/31/23 | $0.20818 |
| 6/28/23 | 6/29/23 | 6/30/23 | $0.18900 |
| 7/27/23 | 7/28/23 | 7/31/23 | $0.17946 |
| 8/29/23 | 8/30/23 | 8/31/23 | $0.17700 |
| 9/27/23 | 9/28/23 | 9/29/23 | $0.17920 |
| 10/27/23 | 10/30/23 | 10/31/23 | $0.13745 |
| 11/28/23 | 11/29/23 | 11/30/23 | $0.15837 |
| 12/27/23 | 12/28/23 | 12/29/23 | $0.20135 |
|
2024 |
|||
| 1/29/24 | 1/30/24 | 1/31/24 | $0.13445 |
| 2/27/24 | 2/28/24 | 2/29/24 | $0.13569 |
| 3/26/24 | 3/27/24 | 3/28/24 | $0.14285 |
| 4/26/24 | 4/29/24 | 4/30/24 | $0.14025 |
| 5/30/24 | 5/30/24 | 5/31/24 | $0.14049 |
| 6/27/24 | 6/27/24 | 6/28/24 | $0.13227 |
| 7/30/24 | 7/30/24 | 7/31/24 | $0.13369 |
| 8/29/24 | 8/29/24 | 8/30/24 | $0.12141 |
| 9/27/24 | 9/27/24 | 9/30/24 | $0.11979 |
| 10/30/24 | 10/30/24 | 10/31/24 | $0.12455 |
| 11/27/24 | 11/27/24 | 11/29/24 | $0.12985 |
| 12/30/24 | 12/30/24 | 12/31/24 | $0.17200 |
|
2025 |
|||
| 1/30/25 | 1/30/25 | 1/31/25 | $0.13429 |
| 2/27/25 | 2/27/25 | 2/28/25 | $0.13337 |
| 3/28/25 | 3/28/25 | 3/31/25 | $0.12901 |
| 4/29/25 | 4/29/25 | 4/30/25 | $0.11229 |
| 5/29/25 | 5/29/25 | 5/30/25 | $0.11379 |
| 6/27/25 | 6/27/25 | 6/30/25 | $0.13865 |
| 7/30/25 | 7/30/25 | 7/31/25 | $0.12212 |
| 8/28/25 | 8/28/25 | 8/29/25 | $0.11962 |
| 9/29/25 | 9/29/25 | 9/30/25 | $0.12054 |
| 10/30/25 | 10/30/25 | 10/31/25 | $0.11645 |
| 11/26/25 | 11/26/25 | 11/28/25 | $0.11104 |
| 12/30/25 | 12/30/25 | 12/31/25 | $0.16880 |
|
2026 |
|||
| 1/29/26 | 1/29/26 | 1/30/26 | $0.12529 |
| 2/26/26 | 2/26/26 | 2/27/26 | $0.27058 |
| 3/30/26 | 3/30/26 | 3/31/26 | $0.30383 |
| 4/29/26 | 4/29/26 | 4/30/26 | $0.32120 |
| 5/28/26 | 5/28/26 | 5/29/26 | $0.32541 |
| 6/29/26 | 6/29/26 | 6/30/26 | |
| 7/30/26 | 7/30/26 | 7/31/26 | |
| 8/28/26 | 8/28/26 | 8/31/26 | |
| 9/29/26 | 9/29/26 | 9/30/26 | |
| 10/29/26 | 10/29/26 | 10/30/26 | |
| 11/27/26 | 11/27/26 | 11/30/26 | |
| 12/30/26 | 12/30/26 | 12/31/26 | |
There is no guarantee that distributions will be made.
*As noted in the 2022 distributions above.
* Distribution Rate is the normalized current distribution (annualized) over NAV per share. Distributions may include income, capital gains, or return of capital, & may vary during the year, details in the Fund’s Form 19a-1.
** 30-Day SEC Yield is a standard yield calculation developed by the Securities and Exchange Commission that allows for fairer comparisons among bond funds. It is based on the most recent month end. This figure reflects the income earned from dividends – excluding option income – during the period after deducting the Fund’s expenses for the period.
Fund Holdings
| TOP 10 HOLDINGS | |||
|---|---|---|---|
Fund holdings are subject to change at any time and should not be considered recommendations to buy or sell any security.
Country Allocation

Industry Allocation
Market Capitalization
| LARGE CAP (> $10B): | N/A |
| MID CAP ($2B - $10B): | N/A |
| SMALL CAP ($300M - < $2B): | N/A |
Fund holdings are subject to change at any time and should not be considered recommendations to buy or sell any security.
Performance
| CUMULATIVE (%) | ANNUALIZED (%) | |||||||
|---|---|---|---|---|---|---|---|---|
| 1 Mo. | 3 Mo. | 6 Mo. | YTD | Since Inception | 1 Yr. | 3 Yr. | Since Inception | |
| Month end as of TBD | ||||||||
| NAV | N/A | N/A | N/A | N/A | N/A | N/A | N/A | N/A |
| Closing Price | N/A | N/A | N/A | N/A | N/A | N/A | N/A | N/A |
| VettaFi Energy and Natural Resources Covered Call Index (NDIVY) | N/A | N/A | N/A | N/A | N/A | N/A | N/A | N/A |
| EQM Natural Resources Dividend Income Index (NDIVITR) | N/A | N/A | N/A | N/A | N/A | N/A | N/A | N/A |
| Quarter end as of TBD | ||||||||
| NAV | N/A | N/A | N/A | N/A | N/A | N/A | N/A | N/A |
| Closing Price | N/A | N/A | N/A | N/A | N/A | N/A | N/A | N/A |
| VettaFi Energy and Natural Resources Covered Call Index (NDIVY) | N/A | N/A | N/A | N/A | N/A | N/A | N/A | N/A |
| EQM Natural Resources Dividend Income Index (NDIVITR) | N/A | N/A | N/A | N/A | N/A | N/A | N/A | N/A |
Fund inception date: 8/23/2022. The performance data quoted represents past performance and does not guarantee future results. Investment return and principal value of an investment will fluctuate so that an investor’s shares, when sold or redeemed, may be worth more or less than the original cost. Current performance may be lower or higher than the performance quoted. Brokerage commissions will reduce returns. NAV is the sum of all its assets less any liabilities, divided by the number of shares outstanding. The closing price is the last price at which the fund traded.
Indexes are unmanaged and it’s not possible to invest directly in an index. VettaFi Energy & Natural Resources Covered Call Index seeks to provide investment exposure to dividend-paying equity securities of energy and natural-resource companies with a systematic covered-call overlay. NDIV previously tracked the EQM Natural Resources Dividend Income Index (NDIVITR) until 1/29/26. EQM Natural Resources Dividend Income Index (NDIVITR) is a gross total return index that seeks to provide investment exposure to dividend-paying equity securities of global companies operating primarily in the natural resource and commodity-related industries.
Extraordinary performance is attributable in part to unusually favorable market conditions and may not be repeated or consistently achieved in the future.
NAV and Market Price
| Previous Day's NAV | Previous Day's Market Price | |||
|---|---|---|---|---|
| Net Asset Value | N/A | Closing Price | N/A | |
| Daily Change | N/A | Daily Change | N/A | |
| % Daily Change | N/A | % Daily Change | N/A | |
| 30-Day Median Bid/Ask Spread | N/A | Premium/Discount % | N/A | |
| Premium Discount History | ||||
Daily Price/NAV Performance
Premium/Discount
The table and line graph are provided to show the frequency at which the closing price of the Fund was at a premium (above) or discount (below) to the Fund's daily net asset value ("NAV"). The table and line graph represent past performance and cannot be used to predict future results. Shareholders may pay more than NAV when buying Fund shares and receive less than an NAV when those shares are sold because shares are bought and sold at current market prices.
| Q1 | Q2 | Q3 | Q4 | ||
|---|---|---|---|---|---|
| Days traded at premium | N/A | N/A | N/A | N/A | N/A |
| Days traded at net asset value | N/A | N/A | N/A | N/A | N/A |
| Days traded at discount | N/A | N/A | N/A | N/A | N/A |
Prior to 1/29/26, the Amplify Energy & Natural Resources Covered Call ETF was the Amplify Natural Resources Dividend Income ETF that previously tracked the EQM Natural Resources Dividend Income Index (NDIVITR).
Investing involves risk, including the possible loss of principal. You could lose money by investing in the Fund. There is no guarantee distributions will be made. Shares of any ETF are bought and sold at market price (not NAV), may trade at a discount or premium to NAV and are not individually redeemed from the Fund. An investment in the Fund is not a deposit of a bank and is not insured or guaranteed by the Federal Deposit Insurance Corporation or any other governmental agency. There can be no assurance that the Fund’s investment objectives will be achieved.
Because the Fund is non-diversified and can invest a greater portion of its assets in securities of individual issuers than a diversified fund, changes in the market value of a single investment could cause greater fluctuations in share price than would occur in a diversified fund. Diversification does not assure a profit or protect against a loss in a declining market.
The Fund is subject to the risks associated with companies in the natural resources and commodities-related industries, energy and materials sectors which can cause volatility and affect its value. These industries can be significantly affected by rapid changes in supply and demand, changes in interest rates, government policies and regulations, environmental concerns, worldwide politics and economic conditions. The Fund will invest in American Depositary Receipts which may be subject to certain risks associated with direct investments in the securities of non-U.S. companies, such as currency, political, economic and market risks because their values depend on the performance of the non-dollar denominated underlying non-U.S. securities.
Dividend-Paying Companies are not obligated to pay or continue to pay dividends on their securities. Therefore, there is a possibility that a company could reduce or eliminate the payment of dividends in the future, which could negatively affect the Fund’s performance.
The Fund employs a “passive management” or indexing investment approach that seeks investment results that correspond (before fees and expenses) generally to the performance of its underlying index. Differences in timing of trades and valuation as well as fees and expenses, may cause the fund to not exactly replicate the index known as tracking error.Covered call strategies may limit upside potential while still exposing the Fund to downside risk. Covered puts can incur substantial losses if the underlying asset rises sharply, with premiums offering limited protection. Monthly distributions may include return of capital, which lowers the investor’s cost basis and could result in higher loss.
© 2026 Morningstar, Inc. All rights reserved. The information contained herein: (1) is proprietary to Morningstar and/or its content providers; (2) may not be copied or distributed; and (3) is not warranted to be accurate, complete, or timely. Neither Morningstar nor its content providers are responsible for any damages or losses arising from any use of this information. Past performance is no guarantee of future results.
The Morningstar Rating™ for funds, or “star rating”, is calculated for managed products (including mutual funds, variable annuity and variable life subaccounts, exchange-traded funds, closed-end funds, and separate accounts) with at least a three-year history. Exchange-traded funds and open-ended mutual funds are considered a single population for comparative purposes. It is calculated based on a Morningstar Risk-Adjusted Return measure that accounts for variation in a managed product’s monthly excess performance, placing more emphasis on downward variations and rewarding consistent performance. The Morningstar Rating does not include any adjustment for sales loads. The top 10% of products in each product category receive 5 stars, the next 22.5% receive 4 stars, the next 35% receive 3 stars, the next 22.5% receive 2 stars, and the bottom 10% receive 1 star. The Overall Morningstar Rating for a managed product is derived from a weighted average of the performance figures associated with its three-, five-, and 10-year (if applicable) Morningstar Rating metrics. The weights are: 100% three-year rating for 36-59 months of total returns, 60% five-year rating/40% three-year rating for 60-119 months of total returns, and 50% 10-year rating/30% five-year rating/20% three-year rating for 120 or more months of total returns. While the 10-year overall star rating formula seems to give the most weight to the 10-year period, the most recent three-year period actually has the greatest impact because it is included in all three rating periods. NDIV received 5 stars among 119 funds in the Natural Resources category for the overall and 3-year periods ending 3/31/26.
Amplify Investments LLC serves as the Investment Adviser to the Fund, and Tidal Investments, LLC serves as the investment sub-adviser.