Overview
Why Invest in ETHO ETF?
- Pioneering the Future: The first diversified, fossil-free, sustainable, and responsible U.S. ETF.1
- Raising the Bar: Employing a rigorous 5-level positive and negative screening process to identify companies that align with stringent ESG guidelines, demonstrate lower pollution, and showcase strong operational efficiency compared to their sector and industry counterparts.
- The Future in Mind: Cutting-edge investment methodology developed by climate science and supply chain sustainability professionals at Stanford University.
Objective & Strategy
Behind the Index

Etho Capital, the index provider, is a financial technology company on a mission to align investor profits with a better planet. Etho Capital creates indices and investment strategies that deliver financial performance driven by efficiency, innovation, diversification, and superior ESG sustainability.
Etho Capital’s team uses a positive selection methodology to review more than 10,000 commonly traded public companies to identify the most climate-efficient leaders across industries. Using proprietary climate performance data that includes both supply chain and direct impacts, Etho Capital ranks each public company by climate emissions per dollar invested selecting the equities that are substantially more climate-efficient than their industry average for inclusion into the Etho Climate Leadership Index—US. All fossil fuel, tobacco, weapons, and gambling companies are eliminated from the index. Additionally, the Etho Capital team conducts qualitative research to understand the material environmental, social, and governance (ESG) performance of each company to reduce additional ESG risks. Finally, Etho Capital consults with experts from industry, academia and non-governmental organization (NGO) partners on relevant corporate ESG issues as a final check against ESG risks.
Key Information
Fund Details
| Ticker | ETHO |
| Launch Date | 11/18/2015 |
| Primary Exchange | NYSE Arca |
| CUSIP | 032108557 |
| Net Assets | $196,512,930 |
| Shares Outstanding | 2,350,000 |
| Holdings (view all holdings) | 286 |
| Total Expense Ratio i | 0.45% |
Index Details
| Index Name | Etho Climate Leadership Index – US |
| Index Ticker | ETHO |
| Index Provider | Etho Capital, LLC |
| Weighting Methodology | Equal Weight |
| Rebalance Frequency | Annual |
| Index Website | ethocapital.com |
Index Selection Methodology: Etho Capital’s Smart Sustainability Process
Quantitative Climate Leadership Selection
Analyze total greenhouse gas pollution from over 10,000 equities to select “climate leaders” in every industry.
Unsustainable Industry Screen
ESG Company Screen
Remove specific companies with poor performance on Environmental, Social, and Governance (ESG) issues.
ESG Expert & Stakeholders Review
ESG experts and stakeholders give qualitative input for Ethos consideration when deciding to remove additional equities.
Equal Weighting
Equal weight the remaining equities so that each represents the same proportional amount within the portfolio.
Performance & Holdings
Performance
| Cumulative (%) | Annualized (%) | |||||||||
|---|---|---|---|---|---|---|---|---|---|---|
| 1MO | 3MO | 6MO | YTD | Since Inception | 1YR | 3YR | 5YR | 10YR | Since Inception | |
| NAV | -1.60% | 8.35% | 16.79% | 21.64% | 249.71% | 34.95% | 13.93% | 6.42% | 12.48% | 12.41% |
| Closing Price | -1.63% | 8.35% | 16.62% | 21.44% | 249.25% | 35.22% | 13.93% | 6.40% | 12.44% | 12.40% |
| Etho Climate Leadership Index - US | -1.67% | 8.20% | 16.54% | 21.38% | 232.36% | 34.43% | 13.43% | 5.90% | 11.96% | 11.88% |
| Cumulative (%) | Annualized (%) | |||||||||
|---|---|---|---|---|---|---|---|---|---|---|
| 1MO | 3MO | 6MO | YTD | Since Inception | 1YR | 3YR | 5YR | 10YR | Since Inception | |
| NAV | 5.77% | 22.00% | 23.62% | 23.62% | 255.40% | 38.75% | 15.88% | 6.92% | 13.21% | 12.69% |
| Closing Price | 5.71% | 21.99% | 23.45% | 23.45% | 255.02% | 39.86% | 15.83% | 6.90% | 13.23% | 12.68% |
| Etho Climate Leadership Index - US | 5.73% | 21.93% | 23.43% | 23.43% | 237.99% | 38.31% | 15.37% | 6.40% | 12.69% | 12.16% |
The performance data quoted represents past performance and does not guarantee future results. Investment return and principal value of an investment will fluctuate so that an investor’s shares, when sold or redeemed, may be worth more or less than the original cost. Current performance may be lower or higher than the performance quoted. Brokerage commissions will reduce returns. NAV is the sum of all its assets less any liabilities, divided by the number of shares outstanding. The closing price is the last price at which the fund traded.
Indexes are unmanaged and it’s not possible to invest directly in an index. The ETHO Climate Leadership Index – US, tracks the performance of U.S. companies that are more climate efficient than their peers.
Extraordinary performance is attributable in part to unusually favorable market conditions and may not be repeated or consistently achieved in the future.
Top 10 Holdings
| Name | Ticker | Market Value (%) | CUSIP | Shares | Market Value ($) |
|---|---|---|---|---|---|
| MaxLinear Inc | MXL | 1.37% | 57776J100 | 32,410 | $2,749,664 |
| Aehr Test Systems | AEHR | 1.02% | 00760J108 | 15,230 | $2,041,734 |
| SELLAS Life Sciences Group Inc | SLS | 0.85% | 81642T209 | 133,032 | $1,700,149 |
| Corcept Therapeutics Inc | CORT | 0.80% | 218352102 | 14,054 | $1,608,761 |
| 10X Genomics Inc | TXG | 0.75% | 88025U109 | 26,711 | $1,498,220 |
| Personalis Inc | PSNL | 0.62% | 71535D106 | 88,855 | $1,247,524 |
| Datadog Inc | DDOG | 0.60% | 23804L103 | 4,752 | $1,213,946 |
| Cheesecake Factory Inc/The | CAKE | 0.59% | 163072101 | 10,462 | $1,186,182 |
| Magnite Inc | MGNI | 0.59% | 55955D100 | 47,585 | $1,176,777 |
| NetApp Inc | NTAP | 0.57% | 64110D104 | 5,521 | $1,143,289 |
Fund holdings are subject to change at any time and should not be considered recommendations to buy or sell any security.
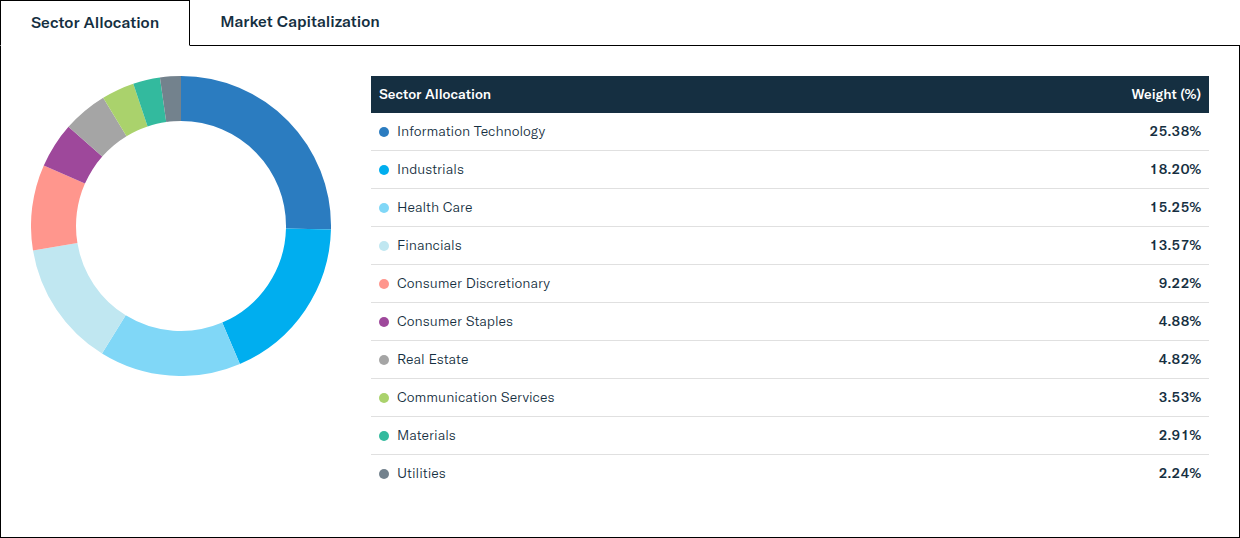
Allocation

| Sector Allocation | Weight (%) |
|---|---|
| Information Technology | 24.64% |
| Industrials | 18.69% |
| Financials | 13.66% |
| Health Care | 13.07% |
| Consumer Discretionary | 10.27% |
| Real Estate | 5.50% |
| Consumer Staples | 4.86% |
| Communication Services | 3.91% |
| Materials | 3.05% |
| Utilities | 2.36% |
| Market Capitalization | Weight (%) |
|---|---|
| Large Capitalization (> $10B) | 40.78% |
| Mid Capitalization ($2B - $10B) | 42.62% |
| Small Capitalization ($300M - < $2B) | 16.60% |
Distributions
| Ex-Date | Record Date | Payable Date | Amount (USD) |
|---|---|---|---|
| 12/30/2026 | 12/30/2026 | 12/31/2026 | — |
There is no guarantee that distributions will be made.
Price
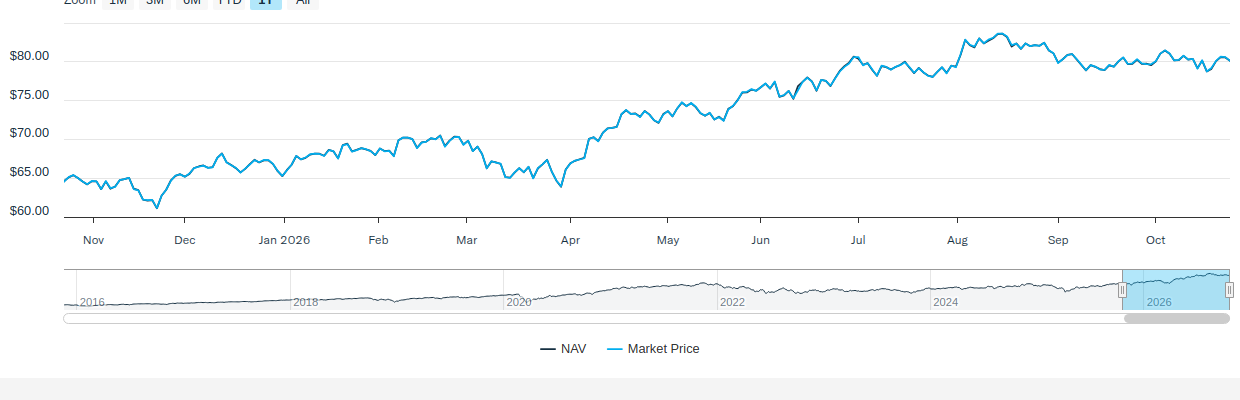
NAV/Market Price
| Previous Day's NAV | |
|---|---|
| Net Asset Value: | $83.62 |
| Daily Change: | $0.05 |
| % Daily Change: | 0.05% |
| 30-Day Median Bid/Ask Spread: | 0.21% |
| Previous Day's Market Price | |
|---|---|
| Closing Price: | $83.64 |
| Daily Change: | $0.01 |
| % Daily Change: | 0.01% |
| % Premium/Discount: | 0.02% |
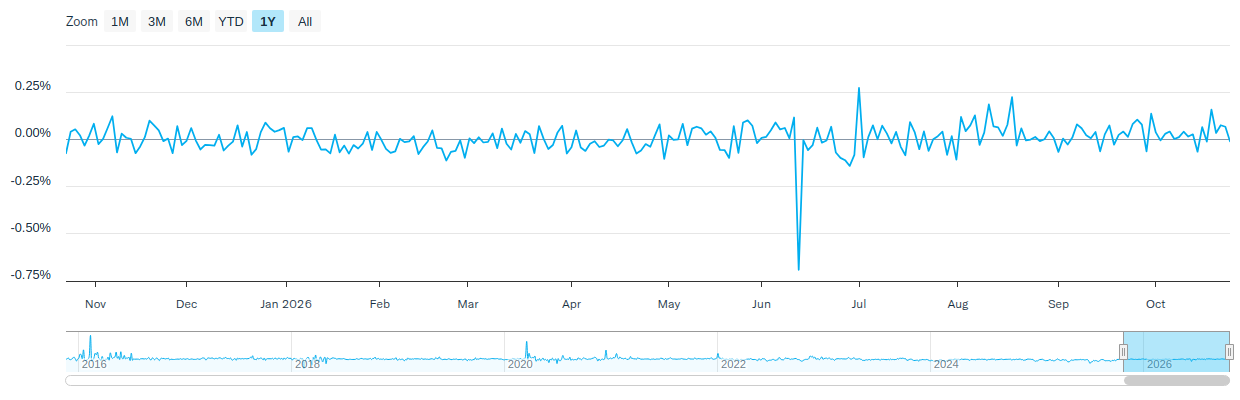
Daily Price/NAV Performance

Premium/Discount

| 2025 | Q1 2026 | Q2 2026 | Q3 2026 | Q4 2026 | |
|---|---|---|---|---|---|
| Days Traded at Premium | 53 | 21 | 27 | - | - |
| Days Traded at NAV | 0 | 0 | 0 | - | - |
| Days Traded at Discount | 198 | 40 | 35 | - | - |
The table and line graph are provided to show the frequency at which the closing price of the Fund was at a premium (above) or discount (below) to the Fund’s daily net asset value (“NAV”). The table and line graph represent past performance and cannot be used to predict future results. Shareholders may pay more than NAV when buying Fund shares and receive less than an NAV when those shares are sold because shares are bought and sold at current market prices.
Literature
Fund Resources
Insights
International Insights: Investing Across the Globe - August 2026
August 12, 2026
Audio Commentary by Tim Seymour, IDVO Portfolio Manager
International Insights: Investing Across the Globe - May 2026
June 8, 2026
Audio Commentary by Tim Seymour, IDVO Portfolio Manager
Climate Capital: The Case for ESG Investing
May 22, 2026
In an era where climate change debates heat the political sphere, many savvy business owners and investors are turning their focus toward a cooler, more sustainable future.
How to Invest
Amplify ETFs trade throughout the day, similar to publicly-traded stocks, on an exchange. There are multiple ways to invest in Amplify ETFs:
- Contact a Financial Advisor to discover how Amplify ETFs may fit within your portfolio.
- Amplify ETFs are available through various online platforms and brokerage accounts.
Connect with your ETF Specialist or call (855) 267-3837
1First-to-market claim is based on a review of industry data as of November 2, 2015. No information to the contrary has come to our attention to date, for more information or inquiries about this claim, please contact info@amplifyetfs.com
Investing involves risk, including the possible loss of principal. Shares of any ETF are bought and sold at market price (not NAV), may trade at a discount or premium to NAV and are not individually redeemed from the Fund. Brokerage commissions will reduce returns. Narrowly focused investments typically exhibit higher volatility. Because the Fund generally does not invest in (i) companies in the energy sector, (ii) companies in the tobacco, aerospace and defense industries, and (iii) companies in the gambling, gold and silver sub-industries, the Fund may underperform the broader equity market to the extent that such companies have above-average performance. Smaller companies may be more vulnerable to adverse business or economic events than larger, more established companies, and may underperform other segments of the market or the equity market as a whole. The Fund’s return may not match or achieve a high degree of correlation with the return of the Index. To the extent the Fund utilizes a sampling approach, it may experience tracking error to a greater extent than if the Fund had sought to replicate.
Amplify Investments LLC is the Investment Adviser to the Fund, and Tidal Investments, LLC serves as the Investment Sub-Adviser.
Amplify ETFs are distributed by Foreside Fund Services, LLC.
ETHO® and the Etho Climate Leadership Index® are registered trademarks of Etho Capital, LLC, all rights reserved.