

Overview
Why Invest in AWAY ETF?
- The first ETF to give investors direct access to technology-focused companies within the global travel and tourism industry.1
- 66% of millennials book their trip using a smartphone. 74% use it to research.2
- Global travel and tourism was forecast to contribute $16.5 trillion USD to global gross domestic product in 2035.3
Objective & Strategy
The Amplify Travel Tech ETF (AWAY) seeks investment results that generally correlate (before fees and expenses) to the total return performance of the Prime Travel Technology Index NTR. AWAY tracks a portfolio of companies in the “Travel Technology Business” that use internet technology to enable travel-related services such as bookings, ride sharing, price comparison, and travel advice.
Key Information
Fund Details
| Ticker | AWAY |
| Launch Date | 02/12/2020 |
| Primary Exchange | NYSE Arca |
| CUSIP | 032108540 |
| Net Assets | $23,835,598 |
| Shares Outstanding | 1,350,000 |
| Holdings (view all holdings) | 27 |
| Total Expense Ratio i | 0.75% |
Index Details
| Index Name | Prime Travel Technology Index NTR |
| Index Ticker | PTRAVELN |
| Index Provider | Prime Indexes |
| Weighting Methodology | Proprietary Market Cap |
| Rebalance Frequency | Quarterly |
| Index Website | primeindexes.com |
Performance & Holdings
Performance
| Cumulative (%) | Annualized (%) | |||||||||
|---|---|---|---|---|---|---|---|---|---|---|
| 1MO | 3MO | 6MO | YTD | Since Inception | 1YR | 3YR | 5YR | 10YR | Since Inception | |
| NAV | 1.66% | 13.28% | 14.50% | -5.34% | -20.67% | -11.55% | 3.40% | -5.94% | — | -3.47% |
| Closing Price | 1.99% | 13.89% | 15.29% | -4.79% | -20.83% | -11.54% | 3.38% | -5.99% | — | -3.50% |
| Prime Travel Technology Index NTR | 1.76% | 13.41% | 15.68% | -4.14% | -21.38% | -12.73% | 3.48% | -6.01% | — | -3.61% |
| Cumulative (%) | Annualized (%) | |||||||||
|---|---|---|---|---|---|---|---|---|---|---|
| 1MO | 3MO | 6MO | YTD | Since Inception | 1YR | 3YR | 5YR | 10YR | Since Inception | |
| NAV | 4.14% | 13.58% | -12.98% | -12.98% | -27.07% | -15.88% | 2.20% | -9.36% | — | -4.83% |
| Closing Price | 5.11% | 13.21% | -12.13% | -12.13% | -26.93% | -15.40% | 2.35% | -9.33% | — | -4.80% |
| Prime Travel Technology Index NTR | 4.08% | 14.72% | -12.03% | -12.03% | -27.85% | -17.09% | 2.26% | -9.44% | — | -4.99% |
The performance data quoted represents past performance and does not guarantee future results. Investment return and principal value of an investment will fluctuate so that an investor’s shares, when sold or redeemed, may be worth more or less than the original cost. Current performance may be lower or higher than the performance quoted. Brokerage commissions will reduce returns. NAV is the sum of all its assets less any liabilities, divided by the number of shares outstanding. The closing price is the last price at which the fund traded.
Indexes are unmanaged and it’s not possible to invest directly in an index. The Prime Travel Tech Index measures the performance of travel technology companies.
Top 10 Holdings
| Name | Ticker | Market Value (%) | CUSIP | Shares | Market Value ($) |
|---|---|---|---|---|---|
| WebBeds Group Ltd | WEB AU | 5.77% | 6015815 | 547,660 | $1,375,012 |
| Expedia Group Inc | EXPE | 5.57% | 30212P303 | 4,664 | $1,327,141 |
| Airbnb Inc | ABNB | 5.51% | 009066101 | 7,921 | $1,314,332 |
| Sabre Corp | SABR | 4.96% | 78573M104 | 509,180 | $1,181,298 |
| On the Beach Group PLC | OTB LN | 4.63% | BYM1K75 | 480,168 | $1,102,773 |
| Booking Holdings Inc | BKNG | 4.53% | 09857L108 | 6,327 | $1,078,880 |
| Uber Technologies Inc | UBER | 4.41% | 90353T100 | 14,827 | $1,050,789 |
| Lyft Inc | LYFT | 4.34% | 55087P104 | 66,717 | $1,034,114 |
| MakeMyTrip Ltd | MMYT | 4.19% | V5633W109 | 20,854 | $998,281 |
| Amadeus IT Group SA | AMS SM | 4.08% | B3MSM28 | 15,166 | $971,315 |
Fund holdings are subject to change at any time and should not be considered recommendations to buy or sell any security.
Allocation
| Market Capitalization | Weight (%) |
|---|---|
| Large Capitalization (> $10B) | 25.06% |
| Mid Capitalization ($2B - $10B) | 19.50% |
| Small Capitalization ($300M - < $2B) | 55.44% |
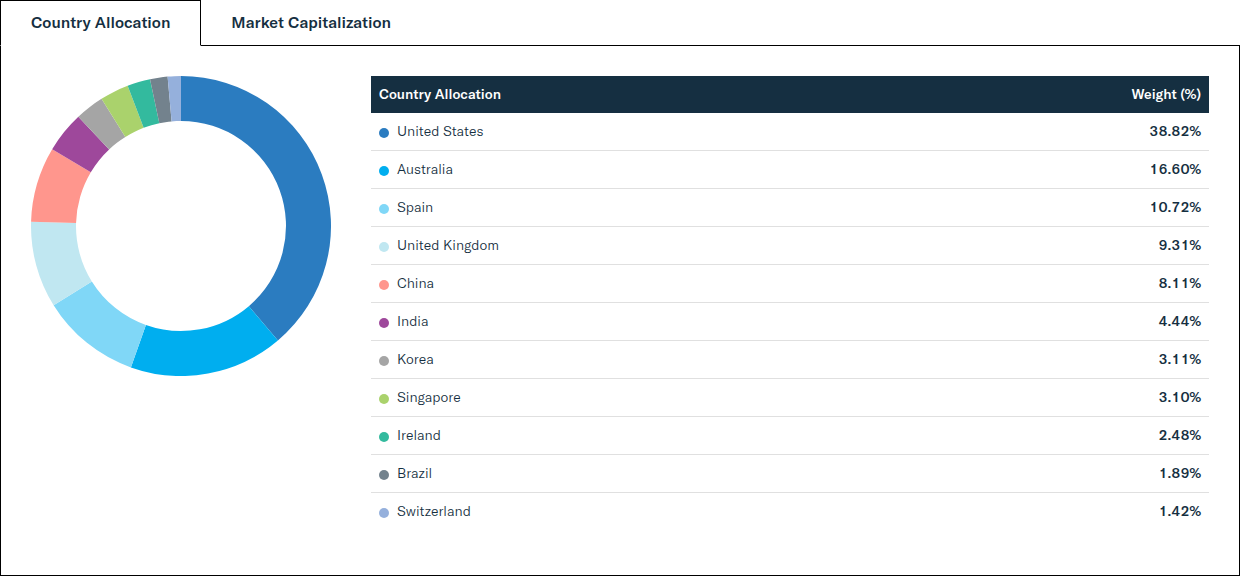
| Country Allocation | Weight (%) |
|---|---|
| United States | 38.82% |
| Australia | 16.60% |
| Spain | 10.72% |
| United Kingdom | 9.31% |
| China | 8.11% |
| India | 4.44% |
| Korea | 3.11% |
| Singapore | 3.10% |
| Ireland | 2.48% |
| Brazil | 1.89% |
| Switzerland | 1.42% |
Distributions
| Ex-Date | Record Date | Payable Date | Amount (USD) |
|---|---|---|---|
| 12/30/2026 | 12/30/2026 | 12/31/2026 | — |
There is no guarantee that distributions will be made.
Price
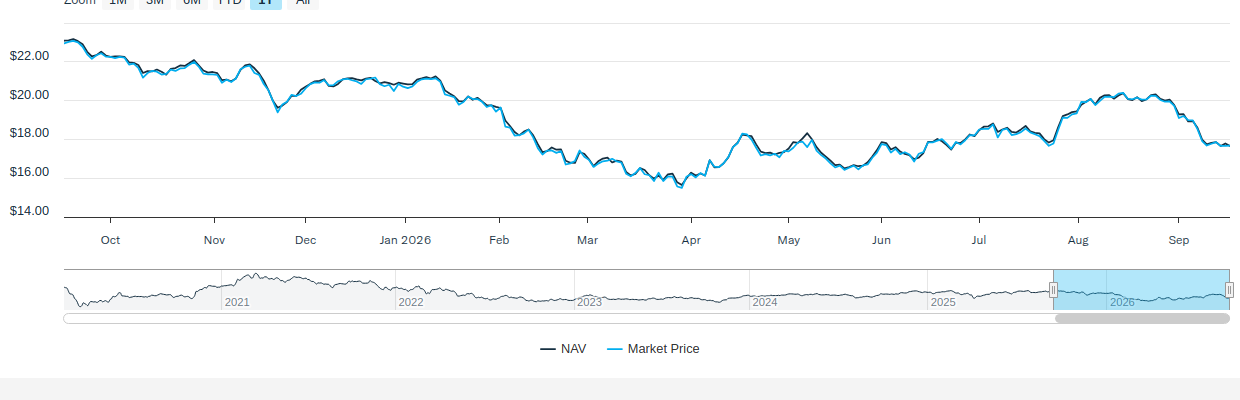
NAV/Market Price
| Previous Day's NAV | |
|---|---|
| Net Asset Value: | $17.66 |
| Daily Change: | $-0.13 |
| % Daily Change: | -0.75% |
| 30-Day Median Bid/Ask Spread: | 0.55% |
| Previous Day's Market Price | |
|---|---|
| Closing Price: | $17.68 |
| Daily Change: | $0.01 |
| % Daily Change: | 0.05% |
| % Premium/Discount: | 0.14% |
Daily Price/NAV Performance
Premium/Discount
| 2025 | Q1 2026 | Q2 2026 | Q3 2026 | Q4 2026 | |
|---|---|---|---|---|---|
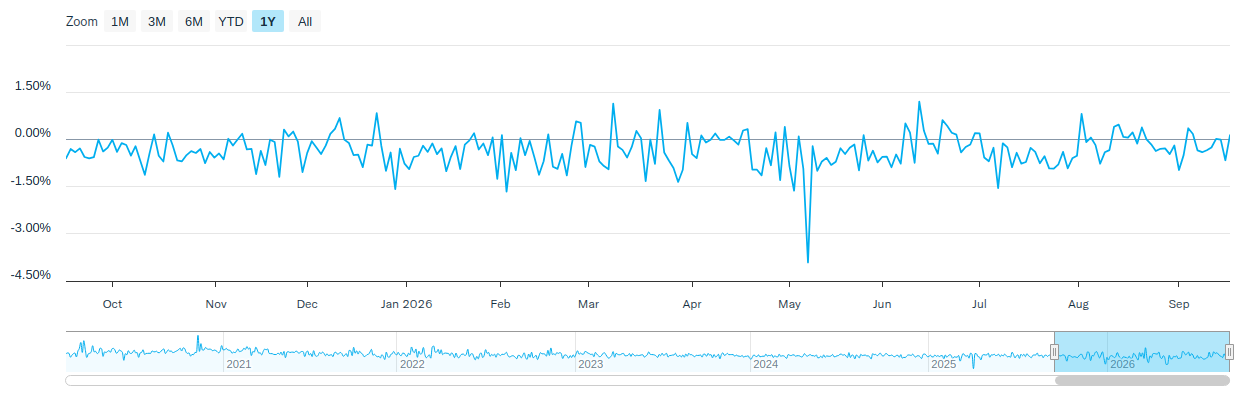
| Days Traded at Premium | 35 | 12 | 18 | - | - |
| Days Traded at NAV | 0 | 0 | 0 | - | - |
| Days Traded at Discount | 216 | 49 | 44 | - | - |
The table and line graph are provided to show the frequency at which the closing price of the Fund was at a premium (above) or discount (below) to the Fund’s daily net asset value (“NAV”). The table and line graph represent past performance and cannot be used to predict future results. Shareholders may pay more than NAV when buying Fund shares and receive less than an NAV when those shares are sold because shares are bought and sold at current market prices.
Literature
Fund Resources
Insights
International Insights: Investing Across the Globe - August 2026
September 17, 2026
Audio Commentary by Tim Seymour, IDVO Portfolio Manager
Midterm Elections, Market Volatility, and the Opportunity Beyond the Headlines
September 17, 2026
What decades of market data can tell us about investing through election cycles
Best Performing ETFs in 2026, ETF Watch Video
September 15, 2026
See which ETF strategies are leading the way and why across AI, cybersecurity, income, and energy year-to-date.
How to Invest
Amplify ETFs trade throughout the day, similar to publicly-traded stocks, on an exchange. There are multiple ways to invest in Amplify ETFs:
- Contact a Financial Advisor to discover how Amplify ETFs may fit within your portfolio.
- Amplify ETFs are available through various online platforms and brokerage accounts.
Connect with your ETF Specialist or call (855) 267-3837
1First-to-market claim is based on a review of industry data as of February 12, 2020. No information to the contrary has come to our attention to date, for more information or inquiries about this claim, please contact info@amplifyetfs.com
2https://www.condorferries.co.uk/millennials-travel-statistics-trends
3World Travel & Tourism Council: Global Travel and Tourism is Strong Despite Economic Headwinds. Nov. 2025.
Investing involves risk, including loss of principal. Shares of any ETF are bought and sold at market price (not NAV), may trade at a discount or premium to NAV and are not individually redeemed from the Fund. Brokerage commissions will reduce returns. Narrowly focused investments typically exhibit higher volatility. Companies in the technology field, including companies in the computers, telecommunications and electronics industries, face intense competition, which may have an adverse effect on profit margins. Technology companies may have limited product lines, markets, financial resources or personnel. The products of technology companies may face obsolescence due to rapid technological developments and frequent new product introduction, and such companies may face unpredictable changes in growth rates, competition for the services of qualified personnel and competition from foreign competitors with lower production costs. Companies in the technology sector are heavily dependent on patent and intellectual property rights. The loss or impairment of these rights may adversely affect the profitability of these companies.
Amplify Investments LLC is the Investment Adviser to the Fund, and Tidal Investments, LLC serves as the Investment Sub-Adviser. Amplify ETFs are distributed by Foreside Fund Services, LLC.