

Overview
Why Invest in ITEQ ETF?
- First Innovative Israeli Tech ETF: Launched in 2015, ITEQ is the first ETF to comprehensively target innovative companies in the Israeli tech industry.1
- Tomorrow’s Tech Themes: ITEQ provides exposure to the technology themes of tomorrow (including cyber security, autonomous driving, artificial intelligence, CleanTech, DefenseTech and 3D printing).
- Unlock Diversification Potential: A diversified approach to incorporating Israeli companies into a global technology allocation.
Objective & Strategy
The Amplify BlueStar Israel Technology ETF (ITEQ) seeks investment results that generally correlate (before fees and expenses) to the total return performance of the BlueStar Israel Global Technology Index™. ITEQ tracks a portfolio of Israeli technology companies that are at the forefront of most technologically disruptive industries, including cyber security, big data hardware and analytics, autonomous driver assistance and safety, clean energy, biotechnology and medical devices.
Key Information
Fund Details
| Ticker | ITEQ |
| Launch Date | 11/02/2015 |
| Primary Exchange | NYSE Arca |
| CUSIP | 032108599 |
| Net Assets | $105,878,453 |
| Shares Outstanding | 1,750,000 |
| Holdings (view all holdings) | 59 |
| Total Expense Ratio i | 0.75% |
Index Details
| Index Name | BlueStar Israel Global Technology Index™ |
| Index Ticker | BGTH |
| Index Provider | MarketVector |
| Weighting Methodology | Float-Adjusted Market Cap |
| Rebalance Frequency | Semi-Annual |
| Index Website | marketvector.com |
Performance & Holdings
Performance
| Cumulative (%) | Annualized (%) | |||||||||
|---|---|---|---|---|---|---|---|---|---|---|
| 1MO | 3MO | 6MO | YTD | Since Inception | 1YR | 3YR | 5YR | 10YR | Since Inception | |
| NAV | 1.18% | -8.04% | 11.66% | 8.77% | 159.63% | 14.42% | 12.70% | -1.65% | 9.75% | 9.21% |
| Closing Price | 1.34% | -7.69% | 12.29% | 8.95% | 160.06% | 14.59% | 12.85% | -1.56% | 9.73% | 9.23% |
| BlueStar Israel Global Technology Index Total Return | 1.28% | -7.87% | 12.28% | 9.40% | 178.60% | 15.48% | 13.46% | -1.16% | 10.46% | 9.92% |
| Cumulative (%) | Annualized (%) | |||||||||
|---|---|---|---|---|---|---|---|---|---|---|
| 1MO | 3MO | 6MO | YTD | Since Inception | 1YR | 3YR | 5YR | 10YR | Since Inception | |
| NAV | -3.02% | 15.40% | 14.70% | 14.70% | 173.79% | 19.17% | 13.20% | -0.85% | 11.14% | 9.91% |
| Closing Price | -3.11% | 15.35% | 14.36% | 14.36% | 172.96% | 18.41% | 13.13% | -0.90% | 11.07% | 9.88% |
| BlueStar Israel Global Technology Index Total Return | -2.95% | 15.81% | 15.25% | 15.25% | 193.49% | 20.18% | 13.95% | -0.37% | 11.85% | 10.63% |
The performance data quoted represents past performance and does not guarantee future results. Investment return and principal value of an investment will fluctuate so that an investor’s shares, when sold or redeemed, may be worth more or less than the original cost. Current performance may be lower or higher than the performance quoted. Brokerage commissions will reduce returns. NAV is the sum of all its assets less any liabilities, divided by the number of shares outstanding. The closing price is the last price at which the fund traded.
Indexes are unmanaged and it’s not possible to invest directly in an index. The BlueStar Israel Global Technology Index (BGTH) is a float-adjusted market-cap-weighted index comprised of Israeli companies that generate at least 50% of their revenue from a technology industry.
Top 10 Holdings
| Name | Ticker | Market Value (%) | CUSIP | Shares | Market Value ($) |
|---|---|---|---|---|---|
| Palo Alto Networks Inc | PANW | 9.95% | 697435105 | 31,873 | $10,538,807 |
| Elbit Systems Ltd | ESLT | 6.83% | M3760D101 | 9,935 | $7,232,680 |
| Tower Semiconductor Ltd | TSEM | 6.20% | M87915274 | 31,017 | $6,560,716 |
| JFrog Ltd | FROG | 3.91% | M6191J100 | 47,495 | $4,140,614 |
| Check Point Software Technologies Ltd | CHKP | 3.55% | M22465104 | 28,553 | $3,758,717 |
| SentinelOne Inc | S | 2.84% | 81730H109 | 152,114 | $3,004,252 |
| Nova Ltd | NVMI | 2.80% | M7516K103 | 7,981 | $2,967,416 |
| Nice Ltd | NICE | 2.62% | 653656108 | 28,244 | $2,772,996 |
| Enlight Renewable Energy Ltd | ENLT IT | 2.46% | 6767677 | 35,044 | $2,601,217 |
| Varonis Systems Inc | VRNS | 2.43% | 922280102 | 57,024 | $2,572,923 |
Fund holdings are subject to change at any time and should not be considered recommendations to buy or sell any security.
Allocation
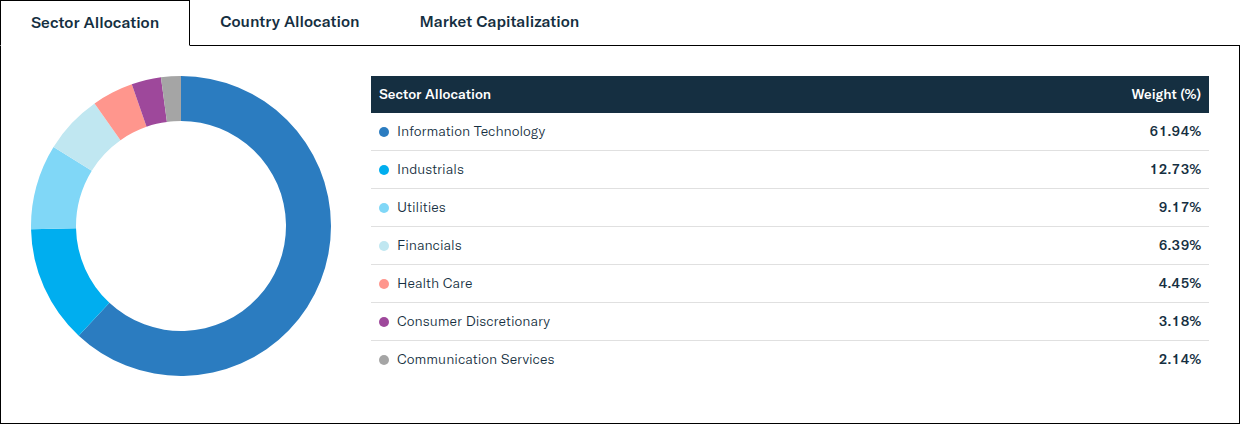
| Sector Allocation | Weight (%) |
|---|---|
| Information Technology | 61.94% |
| Industrials | 12.73% |
| Utilities | 9.17% |
| Financials | 6.39% |
| Health Care | 4.45% |
| Consumer Discretionary | 3.18% |
| Communication Services | 2.14% |
| Market Capitalization | Weight (%) |
|---|---|
| Large Capitalization (> $10B) | 35.74% |
| Mid Capitalization ($2B - $10B) | 37.40% |
| Small Capitalization ($300M - < $2B) | 26.85% |
| Country Allocation | Weight (%) |
|---|---|
| Israel | 65.05% |
| United States | 31.69% |
| Australia | 2.23% |
| Jersey | 1.03% |
Distributions
| Ex-Date | Record Date | Payable Date | Amount (USD) |
|---|---|---|---|
| 12/30/2026 | 12/30/2026 | 12/31/2026 | — |
There is no guarantee that distributions will be made.
Price
NAV/Market Price
| Previous Day's NAV | |
|---|---|
| Net Asset Value: | $60.50 |
| Daily Change: | $0.14 |
| % Daily Change: | 0.24% |
| 30-Day Median Bid/Ask Spread: | 0.21% |
| Previous Day's Market Price | |
|---|---|
| Closing Price: | $60.46 |
| Daily Change: | $0.20 |
| % Daily Change: | 0.33% |
| % Premium/Discount: | -0.07% |
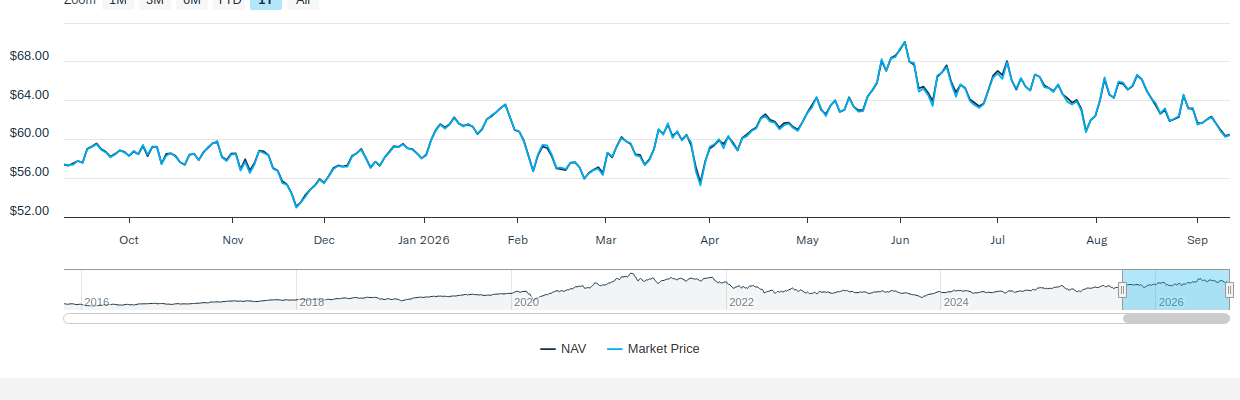
Daily Price/NAV Performance
Premium/Discount
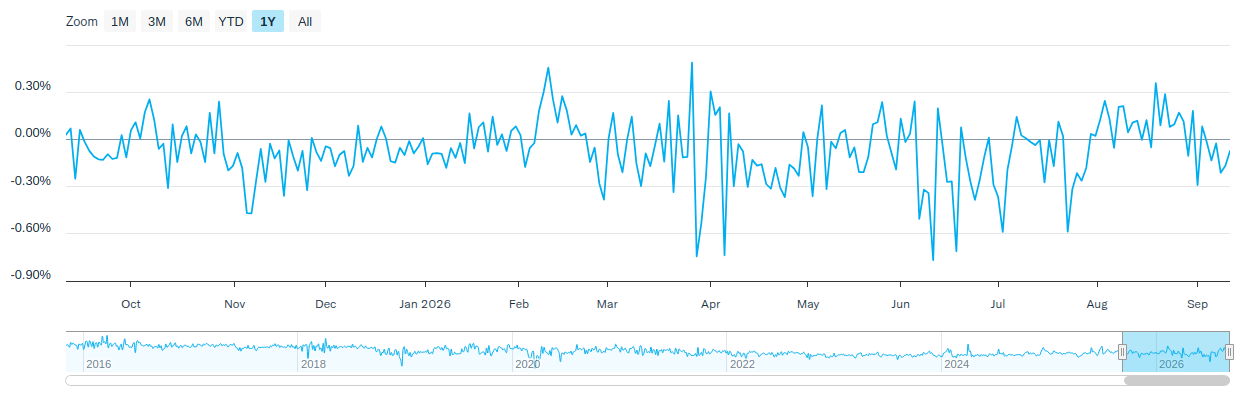
| 2025 | Q1 2026 | Q2 2026 | Q3 2026 | Q4 2026 | |
|---|---|---|---|---|---|
| Days Traded at Premium | 72 | 26 | 19 | - | - |
| Days Traded at NAV | 1 | 0 | 0 | - | - |
| Days Traded at Discount | 178 | 35 | 43 | - | - |
The table and line graph are provided to show the frequency at which the closing price of the Fund was at a premium (above) or discount (below) to the Fund’s daily net asset value (“NAV”). The table and line graph represent past performance and cannot be used to predict future results. Shareholders may pay more than NAV when buying Fund shares and receive less than an NAV when those shares are sold because shares are bought and sold at current market prices.
Literature
Fund Resources
Insights
International Insights: Investing Across the Globe - August 2026
August 12, 2026
Audio Commentary by Tim Seymour, IDVO Portfolio Manager
International Insights: Investing Across the Globe - May 2026
June 8, 2026
Audio Commentary by Tim Seymour, IDVO Portfolio Manager
Climate Capital: The Case for ESG Investing
May 22, 2026
In an era where climate change debates heat the political sphere, many savvy business owners and investors are turning their focus toward a cooler, more sustainable future.
How to Invest
Amplify ETFs trade throughout the day, similar to publicly-traded stocks, on an exchange. There are multiple ways to invest in Amplify ETFs:
- Contact a Financial Advisor to discover how Amplify ETFs may fit within your portfolio.
- Amplify ETFs are available through various online platforms and brokerage accounts.
Connect with your ETF Specialist or call (855) 267-3837
1First-to-market claim is based on a review of industry data as of November 2, 2015. No information to the contrary has come to our attention to date, for more information or inquiries about this claim, please contact info@amplifyetfs.com
Narrowly focused investments typically exhibit higher volatility. Investment in securities of Israeli companies involves risks that may negatively affect the value of your investment in the Fund. Among other things, Israel’s economy depends on imports of certain key items, such as crude oil, coal, grains, raw materials and military equipment. Foreign investing involves special risks such as currency fluctuations and political uncertainty. Funds that invest in smaller companies may experience greater volatility. Funds that emphasize investments in technology generally will experience greater price volatility.
The Fund’s return may not match or achieve a high degree of correlation with the return of the Index. To the extent the Fund utilizes a sampling approach, it may experience tracking error to a greater extent than if the Fund had sought to replicate the Index.
Amplify Investments LLC is the Investment Adviser to the Fund, and Tidal Investments, LLC serves as the Investment Sub-Adviser.