
Overview
Why Invest in ISWN ETF?
- Participation in MSCI EAFE returns while seeking to protect against significant losses.
- Core International Equity Strategy strategy that seeks to mitigate the effects of volatility.
- Low cost, index-based portfolio.
Objective & Strategy
ISWN seeks investment results that correspond to the S-Network International BlackSwan Index (the Index). The Index’s investment strategy seeks exposure to the MSCI EAFE (with no artificial cap), while also protecting against significant losses. Approximately 90% of ISWN is invested in U.S. Treasury securities, and approximately 10% is invested in EFA options in the form of in-the-money calls.

Key Information
Fund Details
| Ticker | ISWN |
| Launch Date | 01/26/2021 |
| Primary Exchange | NYSE Arca |
| CUSIP | 032108821 |
| Net Assets | $36,532,128 |
| Shares Outstanding | 1,650,000 |
| Holdings (view all holdings) | 12 |
| Total Expense Ratio i | 0.49% |
| 30-Day SEC Yield (as of 06/30/2026) i | 3.27% |
Index Details
| Index Name | S-Network International BlackSwan Index |
| Index Ticker | ISWNXT |
| Index Provider | S-Network Global Indexes |
| Rebalance Frequency | Semi-Annual (Jun & Dec) |
| Index Website | S-Network International BlackSwan Index |
Selection Methodology
Rules-Based, Quantitative Index
that seeks to hedge against equity downside while maintaining upside potential over the long term
Equity Exposure
MSCI EAFE Index
Approximately 10% is invested in MSCI EAFE (EFA) options in the form of in-the-money calls
Fixed Income Exposure
Approximately 90% is invested in U.S. Treasury securities, with a targeted duration of the 10-year Treasury note
Index Rebalancing
Occurs every June and December
Performance & Holdings
Performance
| Cumulative (%) | Annualized (%) | |||||||||
|---|---|---|---|---|---|---|---|---|---|---|
| 1MO | 3MO | 6MO | YTD | Since Inception | 1YR | 3YR | 5YR | 10YR | Since Inception | |
| NAV | 0.19% | 4.44% | 5.26% | 5.26% | 1.62% | 11.03% | 8.50% | 0.06% | — | 0.30% |
| Closing Price | 0.23% | 4.26% | 5.22% | 5.22% | 1.63% | 11.08% | 8.57% | 0.06% | — | 0.30% |
| MSCI EAFE Net (USD) | 0.07% | 10.82% | 9.44% | 9.44% | 64.72% | 20.23% | 16.44% | 9.05% | — | 9.63% |
| S-Network BlackSwan International Total Return Index | 0.13% | 4.57% | 5.59% | 5.59% | 7.09% | 13.14% | 9.81% | 1.09% | — | 1.27% |
The performance data quoted represents past performance and does not guarantee future results. Investment return and principal value of an investment will fluctuate so that an investor’s shares, when sold or redeemed, may be worth more or less than the original cost. Current performance may be lower or higher than the performance quoted. Brokerage commissions will reduce returns. NAV is the sum of all its assets less any liabilities, divided by the number of shares outstanding. The closing price is the last price at which the fund traded.
Indexes are unmanaged and it’s not possible to invest directly in an index. The MSCI EAFE Net TR Index (Europe, Australasia, Far East) is a free float‐adjusted market cap index that is designed to measure the equity market performance of developed markets, excluding the U.S. & Canada. The S-Network International BlackSwan Index (Ticker: ISWNXT) holds U.S. Treasury securities and EFA Options.
Top Treasuries
| Name | Ticker | Market Value (%) | CUSIP | Shares | Market Value ($) |
|---|---|---|---|---|---|
| United States Treasury Note/Bond 1.375% 11/15/2031 | 91282CDJ7 | 8.54% | 91282CDJ7 | 3,649,000 | $3,118,327 |
| United States Treasury Note/Bond 2.875% 05/15/2032 | 91282CEP2 | 8.50% | 91282CEP2 | 3,388,000 | $3,106,240 |
| United States Treasury Note/Bond 4% 11/15/2035 | 91282CPJ4 | 8.48% | 91282CPJ4 | 3,277,000 | $3,099,325 |
| United States Treasury Note/Bond 3.375% 05/15/2033 | 91282CHC8 | 8.48% | 91282CHC8 | 3,333,000 | $3,099,104 |
| United States Treasury Note/Bond 4.125% 11/15/2032 | 91282CFV8 | 8.48% | 91282CFV8 | 3,171,000 | $3,097,609 |
Fund holdings are subject to change at any time and should not be considered recommendations to buy or sell any security.
Top Option Holdings
| Name | Ticker | Market Value (%) | CUSIP | Shares | Market Value ($) |
|---|---|---|---|---|---|
| EFA 12/18/2026 88.01 C | 2EFA 261218C00088010 | 8.37% | 2EFA 261218C00088010 | 1,572 | $3,058,593 |
| EFA 06/17/2027 98.01 C | 2EFA 270617C00098010 | 5.96% | 2EFA 270617C00098010 | 1,706 | $2,175,713 |
Fund holdings are subject to change at any time and should not be considered recommendations to buy or sell any security.
Allocation
Distributions
| Ex-Date | Record Date | Payable Date | Amount (USD) |
|---|---|---|---|
| 03/30/2026 | 03/30/2026 | 03/31/2026 | $0.16301 |
| 06/29/2026 | 06/29/2026 | 06/30/2026 | $0.16247 |
| 09/29/2026 | 09/29/2026 | 09/30/2026 | — |
| 12/30/2026 | 12/30/2026 | 12/31/2026 | — |
There is no guarantee that distributions will be made. Distributions may include income, capital gains, or return of capital and may vary during the year, details in the Fund’s Form 19a‑1.
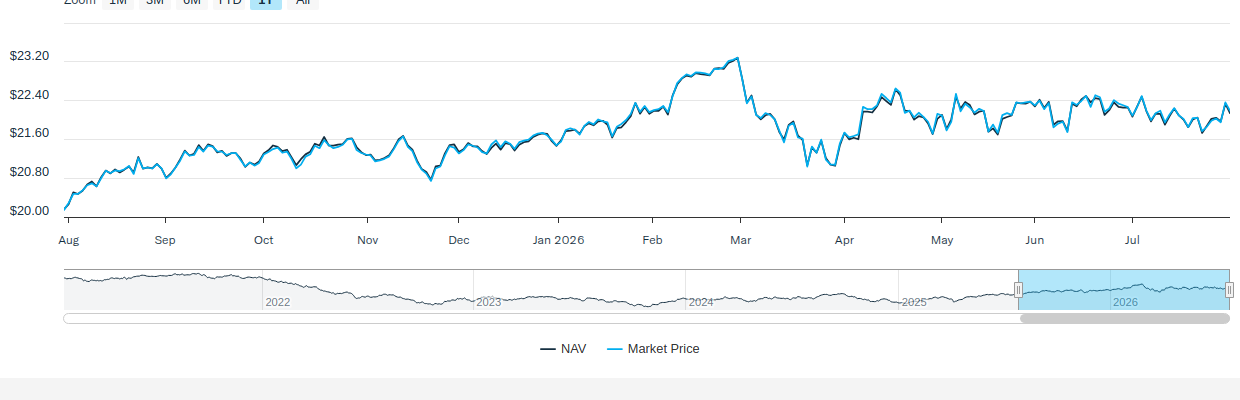
Price
NAV/Market Price
| Previous Day's NAV | |
|---|---|
| Net Asset Value: | $22.14 |
| Daily Change: | $-0.20 |
| % Daily Change: | -0.87% |
| 30-Day Median Bid/Ask Spread: | 0.45% |
| Previous Day's Market Price | |
|---|---|
| Closing Price: | $22.19 |
| Daily Change: | $-0.17 |
| % Daily Change: | -0.78% |
| % Premium/Discount: | 0.22% |
Daily Price/NAV Performance
Premium/Discount
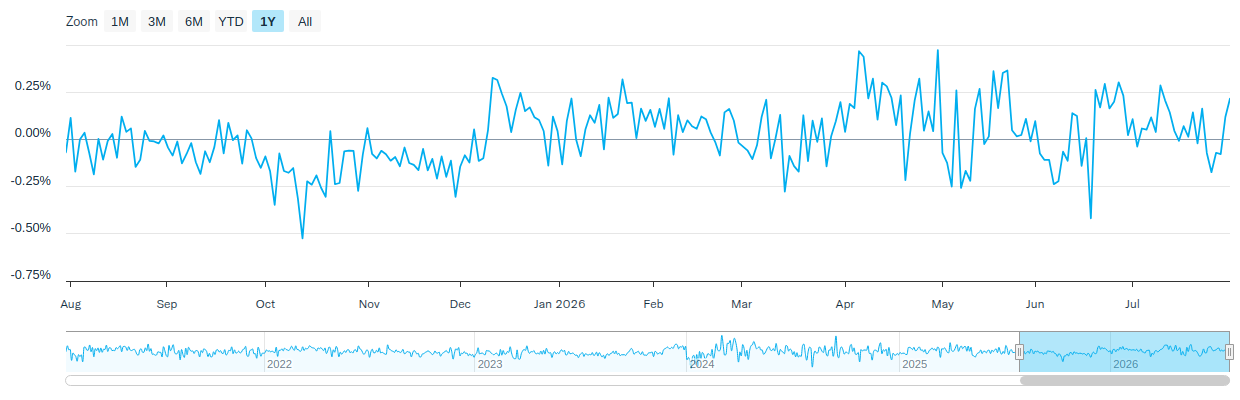
| 2025 | Q1 2026 | Q2 2026 | Q3 2026 | Q4 2026 | |
|---|---|---|---|---|---|
| Days Traded at Premium | 114 | 41 | 44 | - | - |
| Days Traded at NAV | 0 | 1 | 0 | - | - |
| Days Traded at Discount | 137 | 19 | 18 | - | - |
The table and line graph are provided to show the frequency at which the closing price of the Fund was at a premium (above) or discount (below) to the Fund’s daily net asset value (“NAV”). The table and line graph represent past performance and cannot be used to predict future results. Shareholders may pay more than NAV when buying Fund shares and receive less than an NAV when those shares are sold because shares are bought and sold at current market prices.
Literature
Fund Resources
Insights
International Insights: Investing Across the Globe - May 2026
June 8, 2026
Audio Commentary by Tim Seymour, IDVO Portfolio Manager
Climate Capital: The Case for ESG Investing
May 22, 2026
In an era where climate change debates heat the political sphere, many savvy business owners and investors are turning their focus toward a cooler, more sustainable future.
The Digital Economy Is Built on Real Assets
May 20, 2026
Artificial intelligence and the digital economy are driving unprecedented demand for electricity and critical materials—creating a new energy supercycle.
How to Invest
Amplify ETFs trade throughout the day, similar to publicly-traded stocks, on an exchange. There are multiple ways to invest in Amplify ETFs:
- Contact a Financial Advisor to discover how Amplify ETFs may fit within your portfolio.
- Amplify ETFs are available through various online platforms and brokerage accounts.
Connect with your ETF Specialist or call (855) 267-3837
Investing involves risk, including the possible loss of principal. Shares of any ETF are bought and sold at market price (not NAV), may trade at a discount or premium to NAV and are not individually redeemed from the Fund. The Fund is not actively managed. The Fund invests in securities included in its Index regardless of their investment merit.
The Fund’s return may not match or achieve a high degree of correlation with the return of the underlying Index. To the extent the Fund utilizes a sampling approach, it may experience tracking error to a greater extent than if the Fund had sought to replicate the Index. The use of derivative instruments, such as options contracts, can lead to losses because of adverse movements in the price or value of the underlying asset, index or rate, which may be magnified by certain features of the derivatives. Investing in options, including LEAP and/or FLEX Options, and other instruments with option-type elements may increase the volatility and/or transaction expenses of the Fund. An option may expire without value, resulting in a loss of the Fund’s initial investment and may be less liquid and more volatile than an investment in the underlying securities. Investments in debt securities typically decrease in value when interest rates rise. This risk is usually greater for longer-term debt securities. The Fund is non-diversified, meaning it may concentrate its assets in fewer individual holdings than a diversified fund.
The Fund’s investments in options contracts will primarily be long-term equity anticipation securities known as LEAP and/or FLEX Options. LEAP and/or FLEX Options are long-term exchange-traded call options that allow holders the opportunity to participate in the underlying securities’ appreciation in excess of a specified strike price without receiving payments equivalent to any cash dividends declared on the underlying securities.
Call options are financial contracts that give the option buyer the right, but not the obligation, to buy a stock, bond, commodity or other asset or instrument at a specified price within a specific time period. The stock, bond, or commodity is called the underlying asset. A call buyer profits when the underlying asset increases in price. An “in-the-money” call option contract is an option contract with a strike price that is below the current price of the underlying reference asset.
The S-Network International BlackSwan Index (Ticker: ISWNXT) holds U.S. Treasury securities and EFA LEAP and/or FLEX Options. On each rebalancing date, the Index targets 90% of its index market capitalization in U.S. Treasury securities and 10% of its index market capitalization in EFA LEAP and/or FLEX Options. The weighting of U.S. Treasury securities is determined by the option reconstitution schedule. ISWNXT is a trademark of the Index Provider and has been licensed for use for certain purposes by the Adviser. The Index Provider is not affiliated with the Trust, the Adviser, either Sub-Adviser or the Distributor. The Fund is entitled to use the Index pursuant to a sub-licensing agreement with the Adviser. It is not possible to directly invest in an index.
Amplify Investments LLC is the Investment Adviser to the Fund, and Cerity Partners LLC and Tidal Investments, LLC serve as the Investment Sub-Advisers.
Amplify ETFs are distributed by Foreside Fund Services, LLC.