

Overview
Why Invest in GAMR ETF?
- Significant Growth Opportunity: The global video game industry is expected to reach $522.46 billion in 2025 and grow to $691.31 billion in 20291
- New Strategies for Monetization: Revenue from in-app advertising and mobile consumers is growing faster than PC gaming and console revenues. The near-term path to growth lies in embracing new monetization strategies and reaching untapped markets and demographics2
- AI Transformation of Gaming: Video game developers are utilizing AI for a myriad of processes, including programming characters, generating game levels, moderating game chats and customizing and personalizing in-game experiences3
Objective & Strategy
The Amplify Video Game Leaders ETF (GAMR) offers access to global companies in the video gaming value chain, including game development, publishing, mobile and online games, GPUs, development platforms, supporting software, hardware, peripherals, and the metaverse. GAMR seeks investment results that generally correlate (before fees and expenses) to the VettaFi Video Game Leaders Index.
Key Information
Fund Details
| Ticker | GAMR |
| Launch Date | 03/08/2016 |
| Primary Exchange | NYSE Arca |
| CUSIP | 032108615 |
| Net Assets | $39,224,663 |
| Shares Outstanding | 430,000 |
| Holdings (view all holdings) | 24 |
| Total Expense Ratio i | 0.59% |
Index Details
| Index Name | VettaFi Video Game Leaders Index |
| Index Ticker | VGAMET |
| Index Provider | VettaFi |
| Weighting Methodology | Modified Market Cap |
| Rebalance Frequency | Quarterly |
| Index Website | vettafi.com |
Performance & Holdings
Performance
| Cumulative (%) | Annualized (%) | |||||||||
|---|---|---|---|---|---|---|---|---|---|---|
| 1MO | 3MO | 6MO | YTD | Since Inception | 1YR | 3YR | 5YR | 10YR | Since Inception | |
| NAV | -2.31% | 22.30% | -0.13% | -0.13% | 301.65% | 7.62% | 14.81% | -0.30% | 13.56% | 14.43% |
| Closing Price | -2.25% | 20.81% | 0.08% | 0.08% | 301.21% | 7.21% | 14.74% | -0.26% | 13.45% | 14.42% |
| Amplify Video Game Leaders ETF Blended Index | -2.15% | 22.73% | 0.67% | 0.67% | 326.01% | 8.85% | 16.14% | 0.56% | 14.20% | 15.09% |
| S&P 500 TR | -0.95% | 15.20% | 10.21% | 10.21% | 351.22% | 22.32% | 20.61% | 13.41% | 15.51% | 15.73% |
| VettaFi Video Game Leaders Total Return Index (USD) | -2.15% | 22.73% | 0.67% | 0.67% | 0.00% | 8.85% | 0.00% | 0.00% | 0.00% | — |
The performance data quoted represents past performance and does not guarantee future results. Investment return and principal value of an investment will fluctuate so that an investor’s shares, when sold or redeemed, may be worth more or less than the original cost. Current performance may be lower or higher than the performance quoted. Brokerage commissions will reduce returns. NAV is the sum of all its assets less any liabilities, divided by the number of shares outstanding. The closing price is the last price at which the fund traded.
Indexes are unmanaged and it’s not possible to invest directly in an index. The VettaFi Video Game Leaders Index tracks the performance of a concentrated portfolio of companies that are components of the video gaming value-chain.
Top 10 Holdings
| Name | Ticker | Market Value (%) | CUSIP | Shares | Market Value ($) |
|---|---|---|---|---|---|
| Advanced Micro Devices Inc | AMD | 10.27% | 007903107 | 7,781 | $4,029,157 |
| Meta Platforms Inc | META | 9.94% | 30303M102 | 6,686 | $3,897,269 |
| Microsoft Corp | MSFT | 9.69% | 594918104 | 9,736 | $3,801,811 |
| NVIDIA Corp | NVDA | 9.21% | 67066G104 | 18,549 | $3,613,902 |
| Tencent Holdings Ltd | 700 HK | 9.11% | BMMV2K8 | 65,170 | $3,574,692 |
| Sea Ltd | SE | 5.84% | 81141R100 | 22,179 | $2,291,091 |
| AppLovin Corp | APP | 5.34% | 03831W108 | 3,971 | $2,092,955 |
| Electronic Arts Inc | EA | 4.90% | 285512109 | 9,357 | $1,920,150 |
| Nintendo Co Ltd | 7974 JT | 4.83% | 6639550 | 42,731 | $1,893,701 |
| Sony Group Corp | 6758 JP | 4.77% | 6821506 | 90,500 | $1,871,309 |
Fund holdings are subject to change at any time and should not be considered recommendations to buy or sell any security.
Allocation

Distributions
| Ex-Date | Record Date | Payable Date | Amount (USD) |
|---|---|---|---|
| 12/30/2026 | 12/30/2026 | 12/31/2026 | — |
There is no guarantee that distributions will be made.
Price
NAV/Market Price
| Previous Day's NAV | |
|---|---|
| Net Asset Value: | $91.22 |
| Daily Change: | $-0.76 |
| % Daily Change: | -0.83% |
| 30-Day Median Bid/Ask Spread: | 0.32% |
| Previous Day's Market Price | |
|---|---|
| Closing Price: | $91.13 |
| Daily Change: | $-0.79 |
| % Daily Change: | -0.86% |
| % Premium/Discount: | -0.10% |
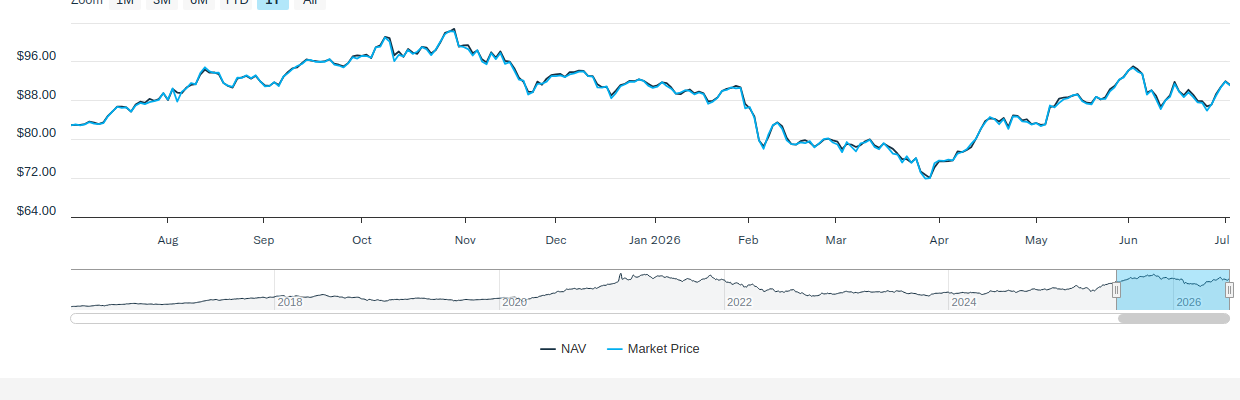
Daily Price/NAV Performance
Premium/Discount
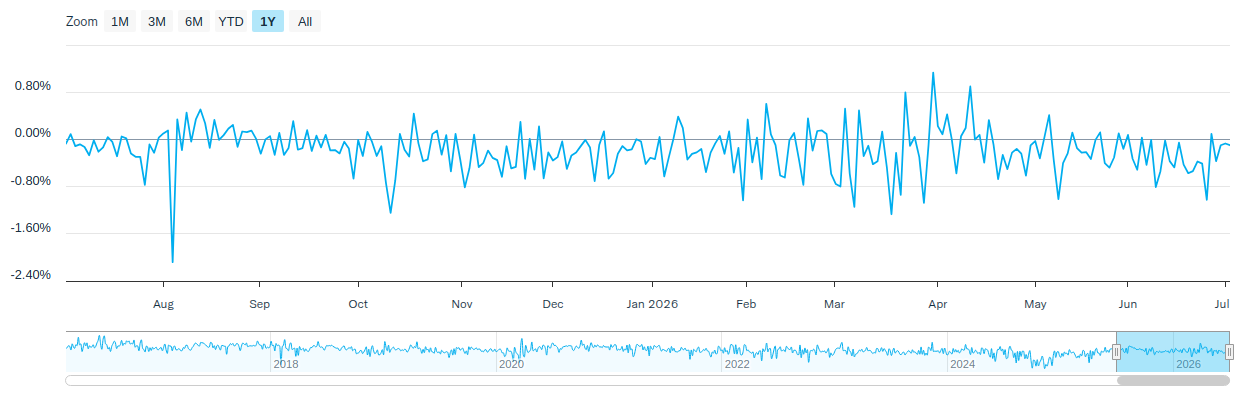
| 2025 | Q1 2026 | Q2 2026 | Q3 2026 | Q4 2026 | |
|---|---|---|---|---|---|
| Days Traded at Premium | 63 | 21 | 17 | - | - |
| Days Traded at NAV | 0 | 0 | 0 | - | - |
| Days Traded at Discount | 188 | 40 | 45 | - | - |
The table and line graph are provided to show the frequency at which the closing price of the Fund was at a premium (above) or discount (below) to the Fund’s daily net asset value (“NAV”). The table and line graph represent past performance and cannot be used to predict future results. Shareholders may pay more than NAV when buying Fund shares and receive less than an NAV when those shares are sold because shares are bought and sold at current market prices.
Literature
Fund Resources
Insights
International Insights: Investing Across the Globe - May 2026
June 8, 2026
Audio Commentary by Tim Seymour, IDVO Portfolio Manager
Climate Capital: The Case for ESG Investing
May 22, 2026
In an era where climate change debates heat the political sphere, many savvy business owners and investors are turning their focus toward a cooler, more sustainable future.
The Digital Economy Is Built on Real Assets
May 20, 2026
Artificial intelligence and the digital economy are driving unprecedented demand for electricity and critical materials—creating a new energy supercycle.
How to Invest
Amplify ETFs trade throughout the day, similar to publicly-traded stocks, on an exchange. There are multiple ways to invest in Amplify ETFs:
- Contact a Financial Advisor to discover how Amplify ETFs may fit within your portfolio.
- Amplify ETFs are available through various online platforms and brokerage accounts.
Connect with your ETF Specialst or call (855) 267-3837
1https://www.statista.com/forecasts/1344668/revenue-video-game-worldwide
2Boston Consulting Group
3Tech Xplore, Northeastern University
Investing involves risk, including the possible loss of principal. Shares of ETFs are bought and sold at market price (not NAV), may trade at a discount or premium to NAV and are not individually redeemed from the Fund. The Fund’s investment objectives may not be achieved. Narrowly focused investments typically exhibit higher volatility. Video Game Tech Companies face intense competition, limited resources, rapid obsolescence, and heavy reliance on patent protection. They also confront growing regulatory challenges in cybersecurity and privacy, potentially impacting profitability and value. Foreign investments, especially emerging markets, add political, economic, and currency risks, along with greater volatility and accounting differences. The Fund is non-diversified, meaning it may concentrate its assets in fewer individual holdings than a diversified fund.
Investments in smaller companies tend to have limited liquidity and greater price volatility than large capitalization companies. The Fund’s return may not match or achieve a high degree of correlation with the return of the Index. To the extent the Fund utilizes a sampling approach, it may experience greater tracking error compared to replicating the Index.
Amplify Investments LLC is the Investment Adviser and Penserra Capital management LLC is the Investment Sub-Adviser to the Fund.