

| 13.22% |
| Distribution Rate i Distribution Rate is the normalized current distribution (annualized) over NAV per share. Distributions may include return of capital (ROC). Click on "All Distributions→" to view Form 19a-1. |
| 4.65% |
| 30-Day SEC Yield i 30-Day SEC Yield is a standard yield calculation developed by the Securities and Exchange Commission that allows for fairer comparisons among bond funds. It is based on the most recent month end. This figure reflects the income earned from dividends – excluding option income – during the period after deducting the Fund’s expenses for the period. |
| Monthly |
| Distribution Frequency |
Overview
Why Invest in TLTP ETF?
- High Targeted Income: TLTP targets annualized option premium income of 12%, with the potential for additional U.S. Treasury bond income.
- Total Return Focus: Aims to deliver attractive total return by combining consistent premium income from covered calls with upside potential from shares not covered by calls.
- 4x More Options: TLTP uses weekly call options seeking to collect premiums 4x more often than monthly options, enabling the potential for compounded income, enhanced treasury returns, and risk mitigation.
Objective & Strategy
Amplify TLT U.S. Treasury 12% Option Income ETF1 seeks investment results that generally correspond to the performance (before fees and expenses) of the Bloomberg U.S. Treasury 20+ Year 12% Premium Covered Call 2.0 Index. TLTP provides convenient single ticker access to a weekly covered call strategy offering opportunities for a higher level of income and capital appreciation on the shares not covered by calls.
Target option premium income may not be achieved, and income may be significantly below that level during any one‑year period if NAV remains level or declines. Distributions are not guaranteed.
YieldSmart™ ETFs
Key Information
Fund Details
| Ticker | TLTP |
| Launch Date | 10/29/2024 |
| Primary Exchange | Cboe BZX |
| CUSIP | 032108516 |
| Net Assets | $26,829,643 |
| Shares Outstanding | 1,360,000 |
| Holdings (view all holdings) | 3 |
Fees & Expenses
| Management Fee | 0.30% |
| Acquired Fund Fees & Expenses | 0.09% |
| Total Expense Ratio | 0.39% |
Index Details
| Index Name | Bloomberg U.S. Treasury 20+ Year 12% Premium Covered Call 2.0 Index |
| Index Ticker | BTSICTTT |
| Index Provider | Bloomberg |
| Rebalance Frequency | Weekly Options Roll |
| Index Website | Bloomberg.com |
Targeted High-Income Covered Call Construction
TLTP strategy aims to provide a high level of income through buying iShares 20+ Year Treasury Bond ETF (“TLT”) and selling one-week expiration, at-the-money call option contracts, to target annual 12% option income.
Target 12% Option Income Annually
Buy
Buy long-term U.S. treasuries through TLT.
Write
Sell weekly call options on TLT. The number of calls may vary week-to-week, selling only enough calls to generate 12% premium on an annualized basis.
Roll
On a weekly basis, replace expiring covered call option with the new one (roll) to help generate ongoing option premiums.
Distribute
TLTP seeks to pay monthly distributions that include both the targeted options income premiums and the underlying TLT dividends.
Performance & Holdings
Performance
| Cumulative (%) | Annualized (%) | |||||||||
|---|---|---|---|---|---|---|---|---|---|---|
| 1MO | 3MO | 6MO | YTD | Since Inception | 1YR | 3YR | 5YR | 10YR | Since Inception | |
| NAV | 0.88% | -1.67% | -5.11% | -1.56% | -0.27% | 1.51% | — | — | — | -0.15% |
| Closing Price | 0.80% | -1.52% | -4.85% | -1.55% | -0.15% | 1.62% | — | — | — | -0.08% |
| Bloomberg U.S. Treasury 20+ Year 12% Premium Covered Call 2.0 Index | 1.04% | -1.40% | -4.71% | -0.66% | 1.34% | 2.41% | — | — | — | 0.73% |
| Cumulative (%) | Annualized (%) | |||||||||
|---|---|---|---|---|---|---|---|---|---|---|
| 1MO | 3MO | 6MO | YTD | Since Inception | 1YR | 3YR | 5YR | 10YR | Since Inception | |
| NAV | 1.34% | 1.17% | 1.45% | 1.45% | 2.78% | 4.19% | — | — | — | 1.65% |
| Closing Price | 1.39% | 1.17% | 1.36% | 1.36% | 2.80% | 4.18% | — | — | — | 1.67% |
| Bloomberg U.S. Treasury 20+ Year 12% Premium Coverd Call Index | 1.19% | 1.38% | 1.96% | 1.96% | 4.02% | 4.82% | — | — | — | 2.38% |
The performance data quoted represents past performance and does not guarantee future results. Investment return and principal value of an investment will fluctuate so that an investor’s shares, when sold or redeemed, may be worth more or less than the original cost. Current performance may be lower or higher than the performance quoted. Brokerage commissions will reduce returns. NAV is the sum of all its assets less any liabilities, divided by the number of shares outstanding. The closing price is the last price at which the fund traded.
Indexes are unmanaged and it’s not possible to invest directly in an index. Bloomberg U.S. Treasury 20+ Year 12% Premium Covered Call 2.0 Index is designed to provide a targeted annualized option premium income of 12% through writing weekly covered call options.
Top Strategic Holdings
| Name | Ticker | Market Value (%) | CUSIP | Shares | Market Value ($) |
|---|---|---|---|---|---|
| iShares 20+ Year Treasury Bond ETF | TLT | 71.88% | 464287432 | 237,349 | $19,284,606 |
| United States Treasury Note/Bond 5.125% 08/15/2056 | 912810UW6 | 28.08% | 912810UW6 | 7,770,000 | $7,535,079 |
| TLT 09/25/2026 81.5 C | 2TLT 260925C00081500 | -0.24% | 2TLT 260925C00081500 | -1,991 | $-65,703 |
Fund holdings are subject to change at any time and should not be considered recommendations to buy or sell any security.
Allocation
Distributions & Yields
Distributions
| Ex-Date | Record Date | Payable Date | Amount (USD) |
|---|---|---|---|
| 01/29/2026 | 01/29/2026 | 01/30/2026 | $0.22240 |
| 02/26/2026 | 02/26/2026 | 02/27/2026 | $0.22490 |
| 03/30/2026 | 03/30/2026 | 03/31/2026 | $0.24176 |
| 04/29/2026 | 04/29/2026 | 04/30/2026 | $0.24120 |
| 05/28/2026 | 05/28/2026 | 05/29/2026 | $0.23647 |
| 06/29/2026 | 06/29/2026 | 06/30/2026 | $0.23096 |
| 07/30/2026 | 07/30/2026 | 07/31/2026 | $0.22230 |
| 08/28/2026 | 08/28/2026 | 08/31/2026 | $0.21883 |
| 09/29/2026 | 09/29/2026 | 09/30/2026 | — |
| 10/29/2026 | 10/29/2026 | 10/30/2026 | — |
| 11/27/2026 | 11/27/2026 | 11/30/2026 | — |
| 12/30/2026 | 12/30/2026 | 12/31/2026 | — |
Yields
| Distribution Rate | 13.22% | 30-Day SEC Yield | 4.65% |
| Distribution Frequency | Monthly |
There is no guarantee that distributions will be made. Distributions may include income, capital gains, or return of capital and may vary during the year, details in the Fund’s Form 19a‑1.
Price
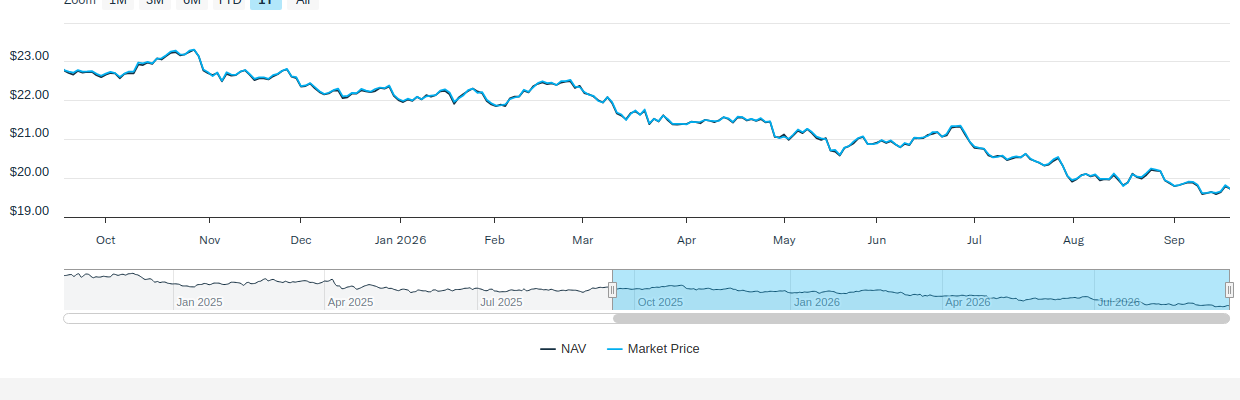
NAV/Market Price
| Previous Day's NAV | |
|---|---|
| Net Asset Value: | $19.73 |
| Daily Change: | $-0.06 |
| % Daily Change: | -0.32% |
| 30-Day Median Bid/Ask Spread: | 0.15% |
| Previous Day's Market Price | |
|---|---|
| Closing Price: | $19.73 |
| Daily Change: | $-0.09 |
| % Daily Change: | -0.47% |
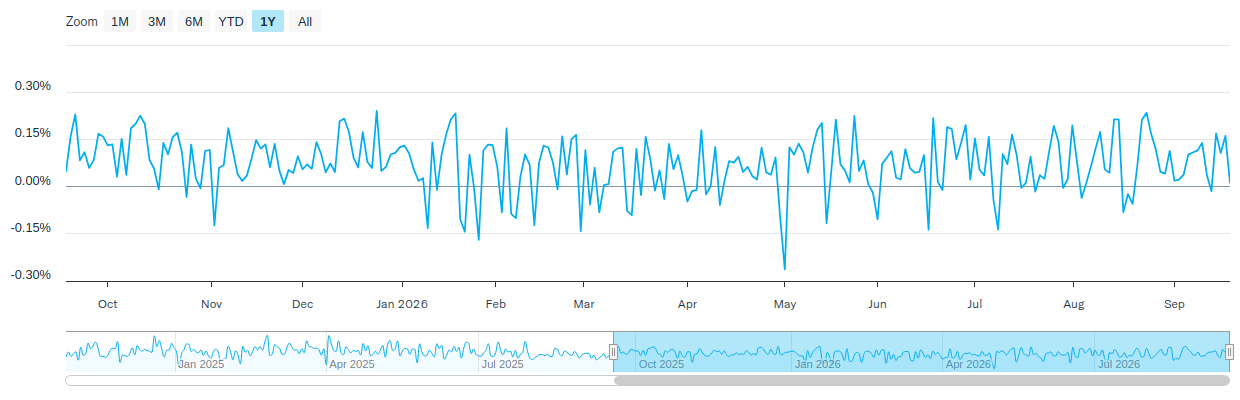
| % Premium/Discount: | 0.01% |
Daily Price/NAV Performance
Premium/Discount
| 2025 | Q1 2026 | Q2 2026 | Q3 2026 | Q4 2026 | |
|---|---|---|---|---|---|
| Days Traded at Premium | 226 | 42 | 50 | - | - |
| Days Traded at NAV | 0 | 0 | 0 | - | - |
| Days Traded at Discount | 25 | 19 | 12 | - | - |
The table and line graph are provided to show the frequency at which the closing price of the Fund was at a premium (above) or discount (below) to the Fund’s daily net asset value (“NAV”). The table and line graph represent past performance and cannot be used to predict future results. Shareholders may pay more than NAV when buying Fund shares and receive less than an NAV when those shares are sold because shares are bought and sold at current market prices.
Literature
Fund Resources
Insights
A Primer on Understanding Stablecoins
September 18, 2026
The Bridge Between Crypto and Your Wallet
International Insights: Investing Across the Globe - August 2026
September 17, 2026
Audio Commentary by Tim Seymour, IDVO Portfolio Manager
Midterm Elections, Market Volatility, and the Opportunity Beyond the Headlines
September 17, 2026
What decades of market data can tell us about investing through election cycles
How to Invest
Amplify ETFs trade throughout the day, similar to publicly-traded stocks, on an exchange. There are multiple ways to invest in Amplify ETFs:
- Contact a Financial Advisor to discover how Amplify ETFs may fit within your portfolio.
- Amplify ETFs are available through various online platforms and brokerage accounts.
Connect with your ETF Specialist or call (855) 267-3837
1Amplify Bloomberg U.S. Treasury 12% Premium Income ETF renamed on/about 11/24/25.
*A covered call refers to a financial transaction in which the investor selling call options owns an equivalent amount of the underlying security.
Investing involves risk, including the possible loss of principal. There can be no assurance that the Fund’s investment objectives will be achieved. Interest Rate Risk is the risk when interest rates rise, there is a corresponding decline in bond values. Conversely, very low or negative interest rates may magnify interest rate risk. The Fund is non-diversified and can invest a greater portion of its assets in individual securities than a diversified fund; changes in the market value of a single investment could cause greater fluctuations in share price than would occur in a diversified fund. The Fund is subject to the risks associated with the Underlying Funds specifically U.S. Treasury Securities Risk. The Fund bears its proportionate share of the Underlying ETF’s expenses.
Covered call risk is the risk that the Fund will forgo, during the option’s life, the opportunity to profit from increases in the market value of the security covering the call option above the sum of the premium and the strike price of the call, but has retained the risk of loss should the price of the underlying security decline. The Fund will also utilize FLEX Options and subject to the risk that the OCC will be unable or unwilling to perform its obligations under the FLEX Options contracts. The Fund currently expects to make distributions on a regular basis, a portion of which may be considered return of capital.
Investment Adviser: Amplify Investments LLC; Sub-Adviser: Samsung Asset Management (New York), Inc.