

| 51.13% |
| Distribution Rate i Distribution Rate is the normalized current distribution (annualized) over NAV per share. Distributions may include return of capital (ROC). Click on "All Distributions→" to view Form 19a-1. |
| 4.10% |
| 30-Day SEC Yield i 30-Day SEC Yield is a standard yield calculation developed by the Securities and Exchange Commission that allows for fairer comparisons among bond funds. It is based on the most recent month end. This figure reflects the income earned from dividends – excluding option income – during the period after deducting the Fund’s expenses for the period. |
| Monthly |
| Distribution Frequency |
Overview
Why Invest in EHY ETF?
- Max Income Focus: EHY seeks 50% – 80% annualized option premium1 plus weekly Ether price appreciation potential.
- 4x More Options: EHY uses weekly call options seeking to collect premiums 4x more often than monthly options, enabling the potential for compounded income and enhanced Ether price returns.
- Harvest Volatility: When Ether price volatility rises, EHY option income potential increases, using volatility to help enhance premium income and total returns.
Objective & Strategy
The Amplify Ethereum Max Income Covered Call ETF seeks to maximize current income through a covered call strategy tied to the investment exposure to the price return of Ether. EHY seeks 50-80% annualized option premium income, while offering Ether upside potential. By using weekly covered call option writing techniques, EHY seeks to harness Ether price volatility, transforming it into valuable income opportunities.
YieldSmart™ ETFs
Key Information
Fund Details
| Ticker | EHY |
| Launch Date | 10/09/2025 |
| Primary Exchange | Cboe BZX |
| CUSIP | 032108417 |
| Net Assets | $3,531,753 |
| Shares Outstanding | 510,000 |
| Holdings (view all holdings) | 3 |
| Total Expense Ratio i | 0.75% |
Portfolio Management
EHY Weekly Covered Call Construction
Seeks 50%-80% Annual Premium Income
Buy
Buy long exposure to Ether through Ethereum exchange-traded products, futures, and options.
Write
Roll
On a weekly basis replace expiring covered call options with new ones (roll) to help generate ongoing option premiums.
Distribute
EHY seeks to pay monthly distributions that include targeted option income premiums.
There is no guarantee distributions will be made. Given market volatility, the actual annualized option premium received may be significantly higher or lower than the stated range.
Performance & Holdings
Performance
| Cumulative (%) | Annualized (%) | |||||||||
|---|---|---|---|---|---|---|---|---|---|---|
| 1MO | 3MO | 6MO | YTD | Since Inception | 1YR | 3YR | 5YR | 10YR | Since Inception | |
| NAV | -26.00% | -28.23% | -48.30% | -48.30% | -62.51% | — | — | — | — | — |
| Closing Price | -26.49% | -28.12% | -47.38% | -47.38% | -62.46% | — | — | — | — | — |
| Cumulative (%) | Annualized (%) | |||||||||
|---|---|---|---|---|---|---|---|---|---|---|
| 1MO | 3MO | 6MO | YTD | Since Inception | 1YR | 3YR | 5YR | 10YR | Since Inception | |
| NAV | -26.00% | -28.23% | -48.30% | -48.30% | -62.51% | — | — | — | — | — |
| Closing Price | -26.49% | -28.12% | -47.38% | -47.38% | -62.46% | — | — | — | — | — |
The performance data quoted represents past performance and does not guarantee future results. Investment return and principal value of an investment will fluctuate so that an investor’s shares, when sold or redeemed, may be worth more or less than the original cost. Current performance may be lower or higher than the performance quoted. Brokerage commissions will reduce returns. NAV is the sum of all its assets less any liabilities, divided by the number of shares outstanding. The closing price is the last price at which the fund traded.
Top Strategic Holdings
| Name | Ticker | Market Value (%) | CUSIP | Shares | Market Value ($) |
|---|---|---|---|---|---|
| ETHA 09/18/2026 11.05 C | 4ETHA 260918C00011050 | 27.18% | 4ETHA 260918C00011050 | 3,671 | $959,930 |
| ETHA 07/14/2026 14.54 C | 4ETHA 260714C00014540 | -0.42% | 4ETHA 260714C00014540 | -3,671 | $-14,684 |
| ETHA 09/18/2026 11.05 P | 4ETHA 260918P00011050 | -4.82% | 4ETHA 260918P00011050 | -3,671 | $-170,114 |
Holdings and allocations are subject to change at any time and should not be considered a recommendation to buy or sell a security. The ETF seeks to participate in the price return of Ether by selling options on Ethereum exchange traded products (ETPs).
Allocation
Distributions & Yields
Distributions
| Ex-Date | Record Date | Payable Date | Amount (USD) |
|---|---|---|---|
| 01/29/2026 | 01/29/2026 | 01/30/2026 | $0.67916 |
| 02/26/2026 | 02/26/2026 | 02/27/2026 | $0.47363 |
| 03/30/2026 | 03/30/2026 | 03/31/2026 | $0.44375 |
| 04/29/2026 | 04/29/2026 | 04/30/2026 | $0.48666 |
| 05/28/2026 | 05/28/2026 | 05/29/2026 | $0.42125 |
| 06/29/2026 | 06/29/2026 | 06/30/2026 | $0.28333 |
| 07/30/2026 | 07/30/2026 | 07/31/2026 | — |
| 08/28/2026 | 08/28/2026 | 08/31/2026 | — |
| 09/29/2026 | 09/29/2026 | 09/30/2026 | — |
| 10/29/2026 | 10/29/2026 | 10/30/2026 | — |
| 11/27/2026 | 11/27/2026 | 11/30/2026 | — |
| 12/30/2026 | 12/30/2026 | 12/31/2026 | — |
Yields
| Distribution Rate | 51.13% | 30-Day SEC Yield | 4.10% |
| Distribution Frequency | Monthly |
There is no guarantee that distributions will be made. Distributions may include income, capital gains, or return of capital and may vary during the year, details in the Fund’s Form 19a‑1.
Price
NAV/Market Price
| Previous Day's NAV | |
|---|---|
| Net Asset Value: | $6.93 |
| Daily Change: | $-0.26 |
| % Daily Change: | -3.61% |
| 30-Day Median Bid/Ask Spread: | 0.44% |
| Previous Day's Market Price | |
|---|---|
| Closing Price: | $6.95 |
| Daily Change: | $-0.25 |
| % Daily Change: | -3.49% |
| % Premium/Discount: | 0.35% |
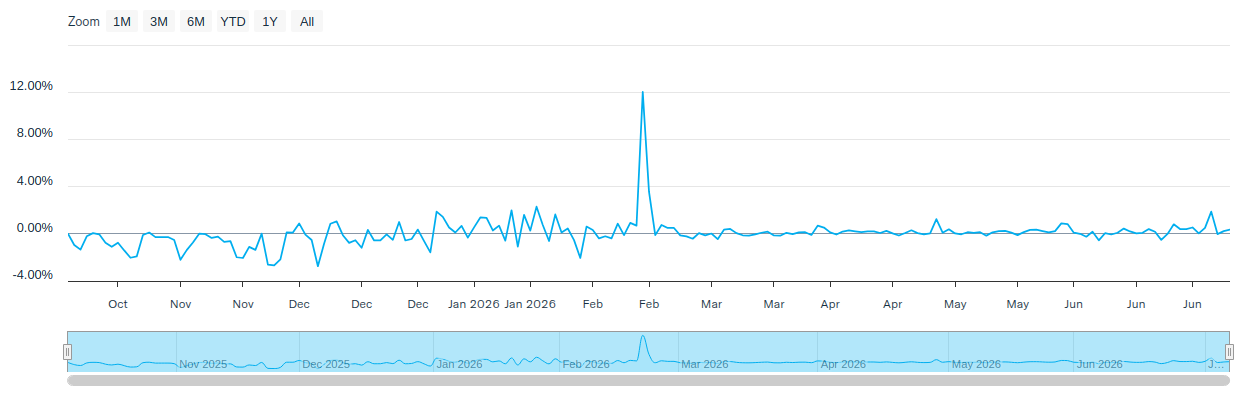
Daily Price/NAV Performance

Premium/Discount
| 2025 | Q1 2026 | Q2 2026 | Q3 2026 | Q4 2026 | |
|---|---|---|---|---|---|
| Days Traded at Premium | 12 | 38 | 50 | - | - |
| Days Traded at NAV | 1 | 0 | 0 | - | - |
| Days Traded at Discount | 46 | 23 | 12 | - | - |
The table and line graph are provided to show the frequency at which the closing price of the Fund was at a premium (above) or discount (below) to the Fund’s daily net asset value (“NAV”). The table and line graph represent past performance and cannot be used to predict future results. Shareholders may pay more than NAV when buying Fund shares and receive less than an NAV when those shares are sold because shares are bought and sold at current market prices.
Literature
Fund Resources
Insights
International Insights: Investing Across the Globe - May 2026
June 8, 2026
Audio Commentary by Tim Seymour, IDVO Portfolio Manager
Climate Capital: The Case for ESG Investing
May 22, 2026
In an era where climate change debates heat the political sphere, many savvy business owners and investors are turning their focus toward a cooler, more sustainable future.
The Digital Economy Is Built on Real Assets
May 20, 2026
Artificial intelligence and the digital economy are driving unprecedented demand for electricity and critical materials—creating a new energy supercycle.
How to Invest
Amplify ETFs trade throughout the day, similar to publicly-traded stocks, on an exchange. There are multiple ways to invest in Amplify ETFs:
- Contact a Financial Advisor to discover how Amplify ETFs may fit within your portfolio.
- Amplify ETFs are available through various online platforms and brokerage accounts.
Connect with your ETF Specialist or call (855) 267-3837
1An option premium is the cost an option buyer pays to the seller for the right to trade an asset at a set price within a certain period.
2OTM means calls are written using an out of the money strategy.
Investing involves risk, including the possible loss of principal. There is no guarantee the investment strategy will be successful. The Fund is considered to be non-diversified. The Fund is actively managed and its performance reflects the investment decisions that the Adviser makes for the Fund.
Ether is a highly speculative asset with a volatile market subject to rapid shifts, regulatory uncertainty, and adoption challenges. Issues such as slow transaction speeds, variable fees, and price swings amplify these risks.
Digital asset regulation remains unsettled, and trading of Ether ETP shares on U.S. exchanges may be halted due to market conditions or exchange discretion. Option prices are volatile and influenced by the underlying asset, interest and currency rates, and expected volatility –all shaped by political and economic policies. FLEX Options may be less liquid than standardized options, making timely exits difficult.
Covered call strategies may limit upside potential while still exposing the Fund to downside risk. Covered puts can incur substantial losses if the underlying asset rises sharply, with premiums offering limited protection. Monthly distributions may include return of capital, which lowers the investor’s cost basis and could result in higher future taxes upon sale –even if shares are sold at a loss.
ETF Express Award Methodologies: https://etfexpress.com/issuer-methodology/
Amplify Investments LLC serves as the investment adviser to the Fund. Kelly Strategic Management, LLC and Penserra Capital Management LLC each serve as investment sub-advisers to the Fund.