

| 10.29% |
| Distribution Rate i Distribution Rate is the normalized current distribution (annualized) over NAV per share. Distributions may include return of capital (ROC). Click on "All Distributions→" to view Form 19a-1. |
| 1.06% |
| 30-Day SEC Yield i 30-Day SEC Yield is a standard yield calculation developed by the Securities and Exchange Commission that allows for fairer comparisons among bond funds. It is based on the most recent month end. This figure reflects the income earned from dividends – excluding option income – during the period after deducting the Fund’s expenses for the period. |
| Monthly |
| Distribution Frequency |
Overview
Why Invest in HCOW ETF?
- Focus on Dividend Income + High Option Premiums: Portfolio of dividend paying high FCF companies that have historically grown dividends plus a covered call strategy that aims to generate approximately 10% or greater annualized income from option premiums.1
- Don’t Be Short Sighted — Look Beyond the Rearview Mirror: Access both trailing and forward free cash flow metrics to help ensure a balanced evaluation of financial health and growth prospects.
- Professionally Managed: Access a professionally managed dividend and option income investment strategy through the efficiency of an ETF.
Objective & Strategy
HCOW is an actively managed strategy-driven ETF that seeks to provide current income through a portfolio of dividend paying companies with characteristics of high free cash flow yield combined with a covered call strategy.
FCF is the remaining cash a company has after covering all expenses.
High FCF is one way to indicate the financial stability of a company.
Trailing FCF measures a company’s remaining cash over a past period of time.
Future FCF estimates a company’s future cash flows and ability to be profitable.
YieldSmart™ ETFs
Key Information
Fund Details
| Ticker | HCOW |
| Launch Date | 09/20/2023 |
| Primary Exchange | NASDAQ |
| CUSIP | 032108680 |
| Net Assets | $17,061,935 |
| Shares Outstanding | 720,000 |
| Holdings (view all holdings) | 60 |
| Total Expense Ratio i | 0.65% |
Portfolio Management
Selection Methodology
Dividends from High Free Cash Flow Exposure
Invests at least 80% of its net assets in the equity securities held by the Amplify Cash Flow Dividend Leaders ETF (COWS ETF). This allocation aims to produce dividend income.
Covered Call Strategy
Covered call options are written on individual stocks on a tactical basis that aim to generate approximately 10% or greater annualized income from option premiums.
Monthly Income Potential
HCOW has a monthly distribution schedule and anticipates its distributions will be comprised of both dividend and option-based income.
Performance & Holdings
Performance
| Cumulative (%) | Annualized (%) | |||||||||
|---|---|---|---|---|---|---|---|---|---|---|
| 1MO | 3MO | 6MO | YTD | Since Inception | 1YR | 3YR | 5YR | 10YR | Since Inception | |
| NAV | -8.69% | 1.71% | 7.46% | 5.71% | 26.43% | 9.43% | 8.44% | — | — | 8.05% |
| Closing Price | -8.60% | 1.78% | 7.63% | 5.57% | 26.57% | 9.51% | 8.50% | — | — | 8.09% |
| S&P 500 TR | -0.35% | 2.30% | 17.85% | 12.75% | 79.14% | 15.74% | 22.89% | — | — | 21.22% |
| Cumulative (%) | Annualized (%) | |||||||||
|---|---|---|---|---|---|---|---|---|---|---|
| 1MO | 3MO | 6MO | YTD | Since Inception | 1YR | 3YR | 5YR | 10YR | Since Inception | |
| NAV | -8.69% | 1.71% | 7.46% | 5.71% | 26.43% | 9.43% | 8.44% | — | — | 8.05% |
| Closing Price | -8.60% | 1.78% | 7.63% | 5.57% | 26.57% | 9.51% | 8.50% | — | — | 8.09% |
| S&P 500 TR | -0.35% | 2.30% | 17.85% | 12.75% | 79.14% | 15.74% | 22.89% | — | — | 21.22% |
The performance data quoted represents past performance and does not guarantee future results. Investment return and principal value of an investment will fluctuate so that an investor’s shares, when sold or redeemed, may be worth more or less than the original cost. Current performance may be lower or higher than the performance quoted. Brokerage commissions will reduce returns. NAV is the sum of all its assets less any liabilities, divided by the number of shares outstanding. The closing price is the last price at which the fund traded.
Indexes are unmanaged and it’s not possible to invest directly in an index. S&P 500 Total Return Index is comprised of the 500 largest U.S. publicly-traded companies.
Top 10 Holdings
| Name | Ticker | Market Value (%) | CUSIP | Shares | Market Value ($) |
|---|---|---|---|---|---|
| Amplify Cash Flow Dividend Leaders ETF | COWS | 4.90% | 032108698 | 22,781 | $836,805 |
| Hewlett Packard Enterprise Co | HPE | 4.73% | 42824C109 | 11,636 | $806,724 |
| TE Connectivity PLC | TEL | 4.32% | G87052109 | 3,348 | $737,765 |
| QUALCOMM Inc | QCOM | 4.21% | 747525103 | 3,886 | $718,405 |
| Hasbro Inc | HAS | 4.04% | 418056107 | 7,704 | $689,816 |
| Avery Dennison Corp | AVY | 4.02% | 053611109 | 4,036 | $685,595 |
| ExxonMobil Holdings Corp | XOM | 4.01% | 30233Q108 | 4,174 | $684,578 |
| Cheniere Energy Inc | LNG | 3.93% | 16411R208 | 2,484 | $670,556 |
| Carlisle Cos Inc | CSL | 3.92% | 142339100 | 2,030 | $668,560 |
| Chevron Corp | CVX | 3.88% | 166764100 | 3,206 | $662,648 |
Fund holdings are subject to change at any time and should not be considered recommendations to buy or sell any security. Characteristics of the underlying securities in the fund’s portfolio do not represent or predict the performance of the fund.
Allocation
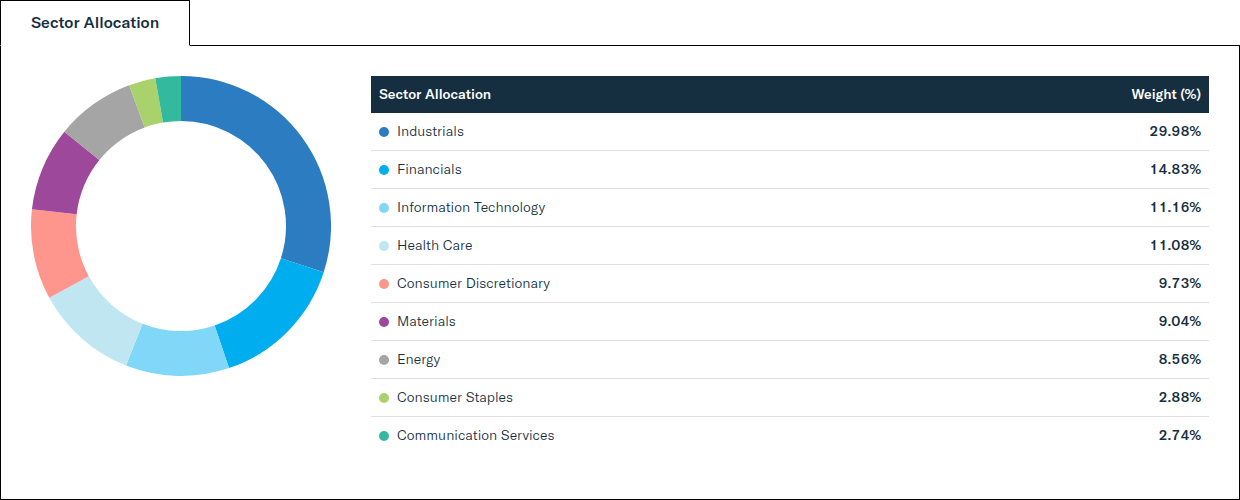
| Sector Allocation | Weight (%) |
|---|---|
| Industrials | 29.98% |
| Financials | 14.83% |
| Information Technology | 11.16% |
| Health Care | 11.08% |
| Consumer Discretionary | 9.73% |
| Materials | 9.04% |
| Energy | 8.56% |
| Consumer Staples | 2.88% |
| Communication Services | 2.74% |
Distributions & Yields
Distributions
| Ex-Date | Record Date | Payable Date | Amount (USD) |
|---|---|---|---|
| 01/29/2026 | 01/29/2026 | 01/30/2026 | $0.24440 |
| 02/26/2026 | 02/26/2026 | 02/27/2026 | $0.22293 |
| 03/30/2026 | 03/30/2026 | 03/31/2026 | $0.23300 |
| 04/29/2026 | 04/29/2026 | 04/30/2026 | $0.23920 |
| 05/28/2026 | 05/28/2026 | 05/29/2026 | $0.24070 |
| 06/29/2026 | 06/29/2026 | 06/30/2026 | $0.24090 |
| 07/30/2026 | 07/30/2026 | 07/31/2026 | $0.25460 |
| 08/28/2026 | 08/28/2026 | 08/31/2026 | $0.21833 |
| 09/29/2026 | 09/29/2026 | 09/30/2026 | $0.20050 |
| 10/29/2026 | 10/29/2026 | 10/30/2026 | — |
| 11/27/2026 | 11/27/2026 | 11/30/2026 | — |
| 12/30/2026 | 12/30/2026 | 12/31/2026 | — |
Yields
| Distribution Rate | 10.29% | 30-Day SEC Yield | 1.06% |
| Distribution Frequency | Monthly |
There is no guarantee that distributions will be made. Distributions may include income, capital gains, or return of capital and may vary during the year, details in the Fund’s Form 19a‑1.
Price
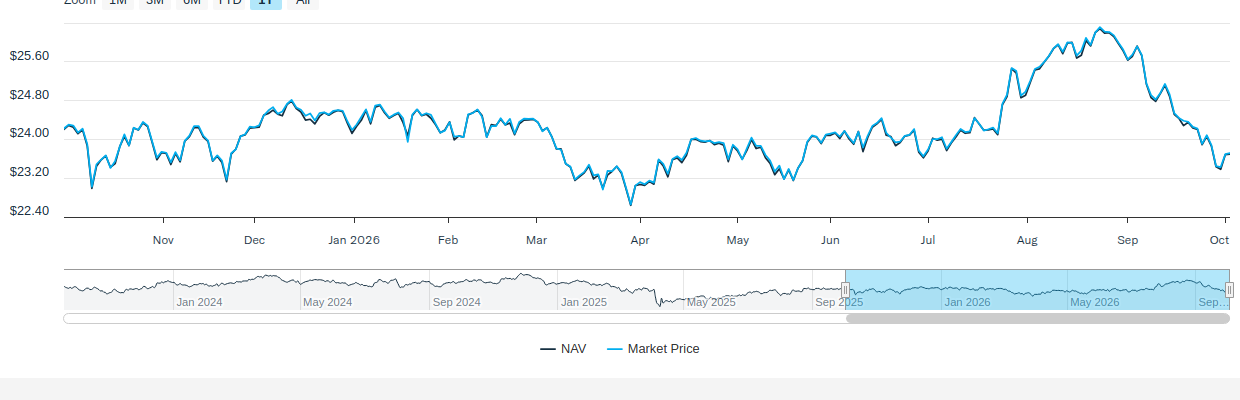
NAV/Market Price
| Previous Day's NAV | |
|---|---|
| Net Asset Value: | $23.70 |
| Daily Change: | $0.01 |
| % Daily Change: | 0.05% |
| 30-Day Median Bid/Ask Spread: | 0.44% |
| Previous Day's Market Price | |
|---|---|
| Closing Price: | $23.72 |
| Daily Change: | $0.02 |
| % Daily Change: | 0.10% |
| % Premium/Discount: | 0.09% |
Daily Price/NAV Performance
Premium/Discount
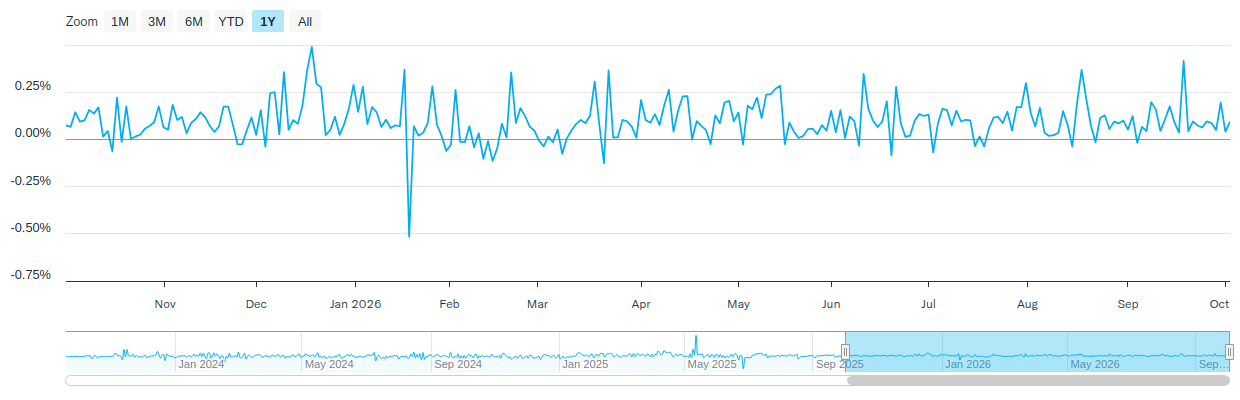
| 2025 | Q1 2026 | Q2 2026 | Q3 2026 | Q4 2026 | |
|---|---|---|---|---|---|
| Days Traded at Premium | 192 | 46 | 56 | 58 | - |
| Days Traded at NAV | 0 | 0 | 0 | 0 | - |
| Days Traded at Discount | 59 | 15 | 6 | 6 | - |
The table and line graph are provided to show the frequency at which the closing price of the Fund was at a premium (above) or discount (below) to the Fund’s daily net asset value (“NAV”). The table and line graph represent past performance and cannot be used to predict future results. Shareholders may pay more than NAV when buying Fund shares and receive less than an NAV when those shares are sold because shares are bought and sold at current market prices.
Literature
Fund Resources
Insights
Digital Assets: Rule Before Law - How the SEC, Treasury, and CFTC Are Writing the Crypto Regulatory Framework Without the CLARITY Act
September 23, 2026
Digital Assets Monthly
Why Top 10 ETFs? Small Group. Big Impact. ETF Watch
September 22, 2026
Focused exposure to leading companies across quantum computing, space, robotics, and Asia memory semiconductors.
BLOK-Chain September 2026
September 21, 2026
Asymmetry Is Set Up for Q4
How to Invest
Amplify ETFs trade throughout the day, similar to publicly-traded stocks, on an exchange. There are multiple ways to invest in Amplify ETFs:
- Contact a Financial Advisor to discover how Amplify ETFs may fit within your portfolio.
- Amplify ETFs are available through various online platforms and brokerage accounts.
Connect with your ETF Specialist or call (855) 267-3837
1The income generated by the covered call option strategy will vary based on factors such as market prices, volatility and interest rates. A covered call is when call options are sold while owning the underlying security.
Prior to 1/28/25, the Fund was formerly the Amplify Cash Flow High Income ETF.
Investing involves risk, including the possible loss of principal. Shares of ETFs are bought and sold at market price (not NAV), may trade at a discount or premium to NAV and are not individually redeemed from the Fund. The Fund’s investment objectives may not be achieved. While the Shares are listed for trading on the Exchange, there is no guarantee that an active trading market will develop or persist. Because the Fund is non-diversified and can invest a greater portion in individual issuers, changes in the market value of a single investment could cause greater fluctuations than in a diversified fund. Diversification does not assure a profit or protect against a loss in a declining market. The Fund is susceptible to operational risks through breaches in cyber security.
The Fund is actively managed and its performance reflects investment decisions that the Adviser makes for the Fund. Covered call risk means the Fund may miss out on potential gains above the call option’s strike price plus premium but still faces the risk of loss if the underlying security’s price declines. The use of option contracts involves investment strategies and risks different from those associated with ordinary portfolio securities transactions. Large-capitalization companies may be less able than smaller-capitalization companies to adapt to changing market conditions.
Amplify Investments LLC serves as the investment adviser to the Fund. Kelly Strategic Management, LLC and Penserra Capital Management LLC each serve as investment sub-advisers to the Fund.