

Overview
Why Invest in DRVR ETF?
- Forward-Looking Dividend Growth Approach: Access companies with 10+ years of dividend increases and forecasted dividend growth—going beyond purely backward-looking dividend screens.
- Quality-Driven Income Focus: Integrates balance sheet strength, cash flow durability and quality metrics to prioritize companies with sustainable dividend growth potential.
- Built for Full Market Cycles: DRVR is designed as a core equity income allocation with diversified sector exposure that can perform across market cycles.
Objective & Strategy
The Amplify S&P 500 Dividend Drivers ETF (DRVR) combines strong historical dividend growth with forward-looking forecasts and quality metrics from S&P Global Market Intelligence to identify 50 high-quality stocks with attractive future dividend growth potential. DRVR seeks to provide investment results (before fees and expenses) that generally correlate to the total return performance of the S&P 500 Dividend Drivers Index.
Key Information
Fund Details
| Ticker | DRVR |
| Launch Date | 07/09/2026 |
| Primary Exchange | NYSE Arca |
| CUSIP | 032108284 |
| Net Assets | $1,235,717 |
| Shares Outstanding | 50,000 |
| Holdings (view all holdings) | 48 |
| Total Expense Ratio i | 0.39% |
| 30-Day SEC Yield (as of 09/30/2026) i | 2.99% |
Index Details
| Index Name | S&P 500 Dividend Drivers Index |
| Index Ticker | SPXDDIUT |
| Index Provider | S&P Dow Jones Indices |
| Rebalance Frequency | Quarterly |
| Index Website | SPGlobal.com |
Selection Methodology
Starting Universe
S&P 500 companies with at least 10 consecutive years of dividend increases and forecasted dividend payments above the prior calendar year’s level.
Security Selection
Rank companies by:
Dividend Growth
5-year dividend-per-share growth vs 5 years prior
Return on Invested Capital
5-year average ROIC*
Forecasted Dividend Yield
Forecasted 12-month dividend yield
Final Portfolio
Select the top 50 companies based on a composite score of the 3 rankings. Weighted by modified forecasted dividend yield, with sector and position limits.
Performance & Holdings
Performance
| Cumulative (%) | Annualized (%) | |||||||||
|---|---|---|---|---|---|---|---|---|---|---|
| 1MO | 3MO | 6MO | YTD | Since Inception | 1YR | 3YR | 5YR | 10YR | Since Inception | |
| NAV | -6.59% | — | — | — | -3.11% | — | — | — | — | — |
| Closing Price | -6.49% | — | — | — | -2.93% | — | — | — | — | — |
| Cumulative (%) | Annualized (%) | |||||||||
|---|---|---|---|---|---|---|---|---|---|---|
| 1MO | 3MO | 6MO | YTD | Since Inception | 1YR | 3YR | 5YR | 10YR | Since Inception | |
| NAV | -6.59% | — | — | — | -3.11% | — | — | — | — | — |
| Closing Price | -6.49% | — | — | — | -2.93% | — | — | — | — | — |
The performance data quoted represents past performance and does not guarantee future results. Investment return and principal value of an investment will fluctuate so that an investor’s shares, when sold or redeemed, may be worth more or less than the original cost. Current performance may be lower or higher than the performance quoted. Brokerage commissions will reduce returns. NAV is the sum of all its assets less any liabilities, divided by the number of shares outstanding. The closing price is the last price at which the fund traded.
Indexes are unmanaged and it’s not possible to invest directly in an index. S&P 500 Dividend Drivers Index is designed to measure the performance of high dividend-paying companies in the S&P 500 (“dividend drivers”) with consistent historical and forecasted dividend growth and strong fundamentals.
Top 10 Holdings
| Name | Ticker | Market Value (%) | CUSIP | Shares | Market Value ($) |
|---|---|---|---|---|---|
| Accenture PLC | ACN | 7.05% | G1151C101 | 405 | $87,059 |
| Altria Group Inc | MO | 4.74% | 02209S103 | 801 | $58,577 |
| Best Buy Co Inc | BBY | 4.12% | 086516101 | 572 | $50,965 |
| United Parcel Service Inc | UPS | 3.87% | 911312106 | 499 | $47,794 |
| Paychex Inc | PAYX | 3.84% | 704326107 | 438 | $47,466 |
| PepsiCo Inc | PEP | 3.36% | 713448108 | 321 | $41,496 |
| Target Corp | TGT | 3.19% | 87612E106 | 254 | $39,449 |
| T Rowe Price Group Inc | TROW | 3.15% | 74144T108 | 391 | $38,951 |
| Mondelez International Inc | MDLZ | 3.10% | 609207105 | 612 | $38,293 |
| Automatic Data Processing Inc | ADP | 2.97% | 053015103 | 131 | $36,722 |
Fund holdings are subject to change at any time and should not be considered recommendations to buy or sell any security.
Allocation
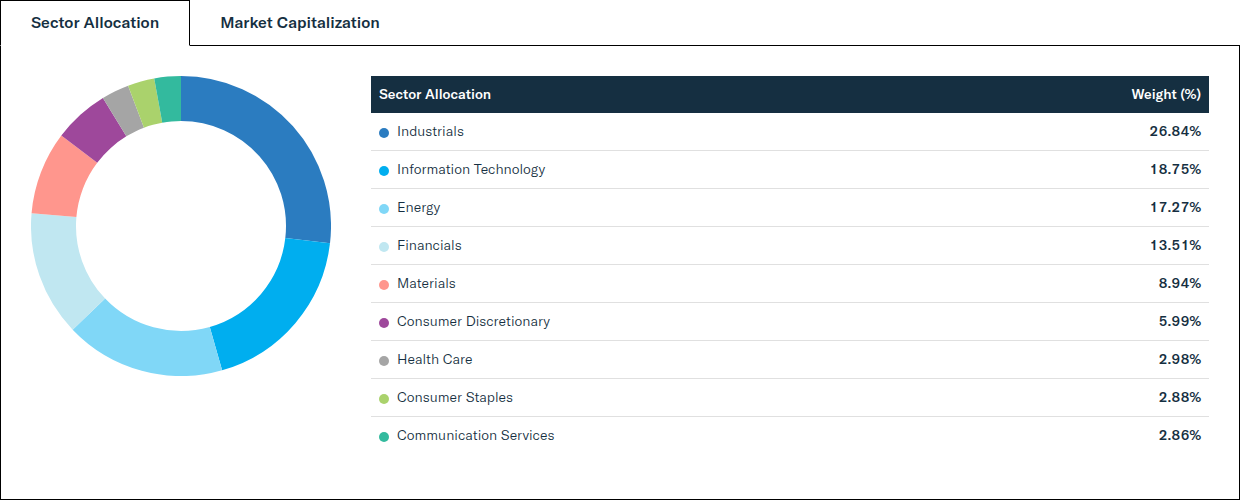
| Sector Allocation | Weight (%) |
|---|---|
| Industrials | 26.84% |
| Information Technology | 18.75% |
| Energy | 17.27% |
| Financials | 13.51% |
| Materials | 8.94% |
| Consumer Discretionary | 5.99% |
| Health Care | 2.98% |
| Consumer Staples | 2.88% |
| Communication Services | 2.86% |
| Market Capitalization | Weight (%) |
|---|---|
| Large Capitalization (> $10B) | 78.04% |
| Mid Capitalization ($2B - $10B) | 21.96% |
| Small Capitalization ($300M - < $2B) | 0.00% |
| Country Allocation | Weight (%) |
|---|---|
| United States | 92.05% |
| Ireland | 5.06% |
| United Kingdom | 2.89% |
Distributions
| Ex-Date | Record Date | Payable Date | Amount (USD) |
|---|---|---|---|
| 07/30/2026 | 07/30/2026 | 07/31/2026 | $0.02620 |
| 08/28/2026 | 08/28/2026 | 08/31/2026 | $0.02965 |
| 09/29/2026 | 09/29/2026 | 09/30/2026 | $0.09432 |
| 10/29/2026 | 10/29/2026 | 10/30/2026 | — |
| 11/27/2026 | 11/27/2026 | 11/30/2026 | — |
| 12/30/2026 | 12/30/2026 | 12/31/2026 | — |
There is no guarantee that distributions will be made.
Price
NAV/Market Price
| Previous Day's NAV | |
|---|---|
| Net Asset Value: | $24.71 |
| Daily Change: | $0.10 |
| % Daily Change: | 0.42% |
| 30-Day Median Bid/Ask Spread: | 0.17% |
| Previous Day's Market Price | |
|---|---|
| Closing Price: | $24.70 |
| Daily Change: | $0.08 |
| % Daily Change: | 0.33% |
| % Premium/Discount: | -0.06% |
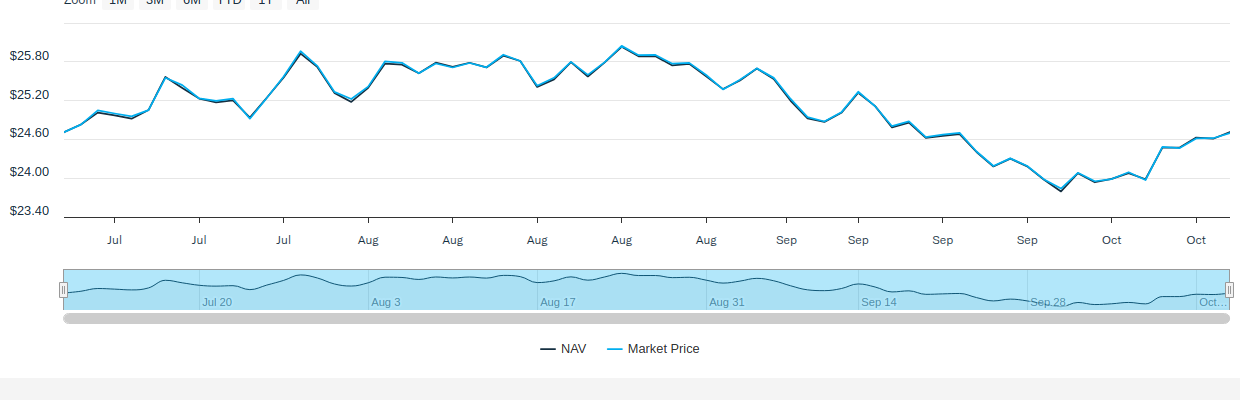
Daily Price/NAV Performance
Premium/Discount
| 2025 | Q1 2026 | Q2 2026 | Q3 2026 | Q4 2026 | |
|---|---|---|---|---|---|
| Days Traded at Premium | - | - | - | 48 | - |
| Days Traded at NAV | - | - | - | 1 | - |
| Days Traded at Discount | - | - | - | 11 | - |
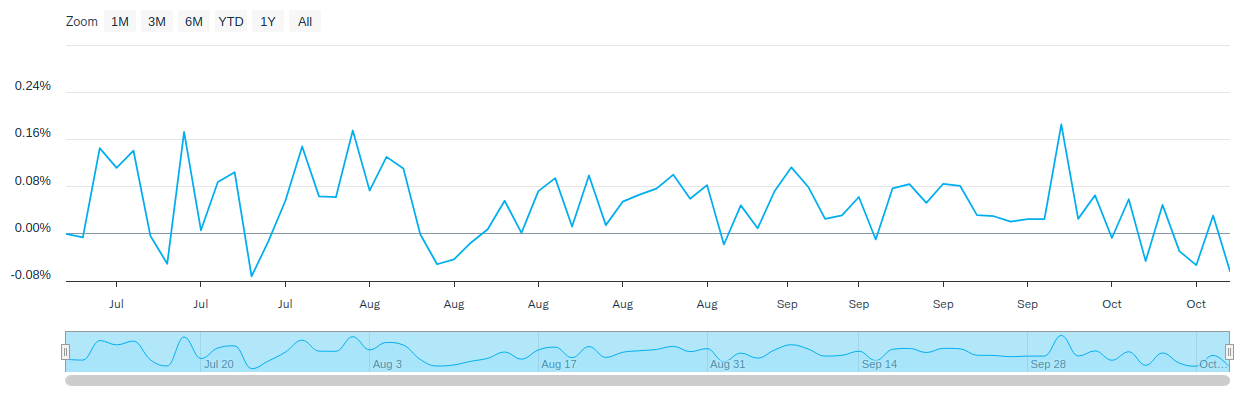
The table and line graph are provided to show the frequency at which the closing price of the Fund was at a premium (above) or discount (below) to the Fund’s daily net asset value (“NAV”). The table and line graph represent past performance and cannot be used to predict future results. Shareholders may pay more than NAV when buying Fund shares and receive less than an NAV when those shares are sold because shares are bought and sold at current market prices.
Literature
Insights
International Insights: Investing Across the Globe - September 2026
October 13, 2026
Audio Commentary by Tim Seymour, IDVO Portfolio Manager
Why Top 10 ETFs? Small Group. Big Impact. ETF Watch
September 22, 2026
Focused exposure to leading companies across quantum computing, space, robotics, and Asia memory semiconductors.
A Primer on Understanding Stablecoins
September 18, 2026
The Bridge Between Crypto and Your Wallet
How to Invest
Amplify ETFs trade throughout the day, similar to publicly-traded stocks, on an exchange. There are multiple ways to invest in Amplify ETFs:
- Contact a Financial Advisor to discover how Amplify ETFs may fit within your portfolio.
- Amplify ETFs are available through various online platforms and brokerage accounts.
Connect with your ETF Specialist or call (855) 267-3837
*ROIC: The metric used to measure how efficiently a company allocates its capital to generate profits.
Investing involves risk, including the possible loss of principal. Shares of any ETF are bought and sold at market price (not NAV), may trade at a discount or premium to NAV and are not individually redeemed from the Fund. Brokerage commissions will reduce returns.
You could lose money by investing in the Fund. The Fund is new and has limited operating history. There can be no assurance that the Fund’s investment objective will be achieved.
The Fund is non-diversified and may be concentrated, which can increase volatility. The Fund focuses on dividend paying securities, and there is no guarantee that portfolio companies will pay or continue to increase dividends. The Fund follows a passive, index based investment approach and is subject to index, tracking error, and non-correlation risks. The Fund may also be more sensitive to risks affecting large capitalization companies and the sectors or industries represented in the Index.
The S&P 500 Dividend Drivers Index is designed to measure the performance of high dividend-paying companies in the S&P 500 (“dividend drivers”) with consistent historical and forecasted dividend growth and strong fundamentals.
Amplify Investments LLC is the Investment Adviser to the Fund and Tidal Investments, LLC is the Investment Sub-Adviser.