

| 3.63% |
| Distribution Rate i Distribution Rate is the normalized current distribution (annualized) over NAV per share. Distributions may include return of capital (ROC). Click on "All Distributions→" to view Form 19a-1. |
| 3.50% |
| 30-Day SEC Yield i 30-Day SEC Yield is a standard yield calculation developed by the Securities and Exchange Commission that allows for fairer comparisons among bond funds. It is based on the most recent month end. This figure reflects the income earned from dividends – excluding option income – during the period after deducting the Fund’s expenses for the period. |
| Monthly |
| Distribution Frequency |
Overview
Why Invest in SOFR ETF?
- Regular Monthly Income Potential: Seeks to provide investors with monthly income equal to the Secured Overnight Financing Rate after fees and expenses.
- Lower Interest Rate Risk: Short-term securities are generally less sensitive to changes in interest rates than securities with longer maturity dates.
- Institutional Active Management: Professionally managed by institutional asset manager Samsung Asset Management (New York).
Objective & Strategy
SOFR ETF is an actively managed strategy aimed to provide current monthly income and reduce risk exposure. SOFR ETF seeks to closely replicate the performance of the Secured Overnight Financing Rate, as published by the Federal Reserve Bank of New York.
What is the Secured Overnight Financing Rate?
The Secured Overnight Financing Rate is a broad measure of the cost of borrowing cash overnight collateralized by Treasury securities.1
Samsung Asset Management is the leading asset manager in Korea with 25 years of experience. Since their founding in 1998, Samsung Asset Management has been creating an investment culture aligned with their philosophy to provide a successful investing experience for their global network of clients.

1New York Fed https://www.newyorkfed.org/markets/reference-rates/sofr
Key Information
Fund Details
| Ticker | SOFR |
| Launch Date | 11/15/2023 |
| Primary Exchange | NYSE Arca |
| CUSIP | 032108672 |
| Net Assets | $452,438,161 |
| Shares Outstanding | 4,510,000 |
| Holdings (view all holdings) | 5 |
| Total Expense Ratio i | 0.20% |
Portfolio Management
Selection Methodology
Growth Equities
Portfolio of large-cap growth equities with historically strong earnings and cash flow characteristics.
Sector Allocation
Relatively balanced across a variety of GICS Sectors with CWP determining which sectors to over- and under-weight based on various factors.
Security Selection
Tactical Covered Call Writing
Performance & Holdings
Performance
| Cumulative (%) | Annualized (%) | |||||||||
|---|---|---|---|---|---|---|---|---|---|---|
| 1MO | 3MO | 6MO | YTD | Since Inception | 1YR | 3YR | 5YR | 10YR | Since Inception | |
| NAV | 0.30% | 0.90% | 1.78% | 2.09% | 12.76% | 3.83% | — | — | — | 4.53% |
| Closing Price | 0.29% | 0.85% | 1.77% | 2.06% | 12.80% | 3.83% | — | — | — | 4.54% |
| Cumulative (%) | Annualized (%) | |||||||||
|---|---|---|---|---|---|---|---|---|---|---|
| 1MO | 3MO | 6MO | YTD | Since Inception | 1YR | 3YR | 5YR | 10YR | Since Inception | |
| NAV | 0.30% | 0.89% | 1.78% | 1.78% | 12.43% | 3.89% | — | — | — | 4.56% |
| Closing Price | 0.30% | 0.89% | 1.76% | 1.76% | 12.47% | 3.92% | — | — | — | 4.57% |
The performance data quoted represents past performance and does not guarantee future results. Investment return and principal value of an investment will fluctuate so that an investor’s shares, when sold or redeemed, may be worth more or less than the original cost. Current performance may be lower or higher than the performance quoted. Brokerage commissions will reduce returns. NAV is the sum of all its assets less any liabilities, divided by the number of shares outstanding. The closing price is the last price at which the fund traded.
Top Strategic Holdings
| Name | Ticker | Market Value (%) | CUSIP | Shares | Market Value ($) |
|---|---|---|---|---|---|
| SOF REPO 08/27/26 3.66% 08/27/2026 | SOF082726 | 33.15% | SOF082726 | 150,000,000 | $150,000,000 |
| SOF REPO 08/26/26 3.69% 08/26/2026 | SOF0826264 | 27.05% | SOF0826264 | 122,390,000 | $122,390,000 |
| SOF REPO 08/26/26 3.68% 08/26/2026 | SOF0826261 | 17.68% | SOF0826261 | 79,998,919 | $79,998,919 |
| SOF REPO 08/26/26 3.68% 08/26/2026 | SOF0826263 | 15.47% | SOF0826263 | 69,999,780 | $69,999,780 |
| Brookfield Corporate Treasury Ltd 08/31/2026 | 11271GHX4 | 6.63% | 11271GHX4 | 30,000,000 | $29,983,333 |
Fund holdings are subject to change at any time and should not be considered recommendations to buy or sell any security.
Allocation
Distributions & Yields
Distributions
| Ex-Date | Record Date | Payable Date | Amount (USD) |
|---|---|---|---|
| 01/29/2026 | 01/29/2026 | 01/30/2026 | $0.30367 |
| 02/26/2026 | 02/26/2026 | 02/27/2026 | $0.30442 |
| 03/30/2026 | 03/30/2026 | 03/31/2026 | $0.30272 |
| 04/29/2026 | 04/29/2026 | 04/30/2026 | $0.30442 |
| 05/28/2026 | 05/28/2026 | 05/29/2026 | $0.29680 |
| 06/29/2026 | 06/29/2026 | 06/30/2026 | $0.30099 |
| 07/30/2026 | 07/30/2026 | 07/31/2026 | $0.30272 |
| 08/28/2026 | 08/28/2026 | 08/31/2026 | — |
| 09/29/2026 | 09/29/2026 | 09/30/2026 | — |
| 10/29/2026 | 10/29/2026 | 10/30/2026 | — |
| 11/27/2026 | 11/27/2026 | 11/30/2026 | — |
| 12/29/2026 | 12/29/2026 | 12/30/2026 | — |
Yields
| Distribution Rate | 3.63% | 30-Day SEC Yield | 3.50% |
| Distribution Frequency | Monthly |
There is no guarantee that distributions will be made. Distributions may include income, capital gains, or return of capital and may vary during the year, details in the Fund’s Form 19a‑1.
Price
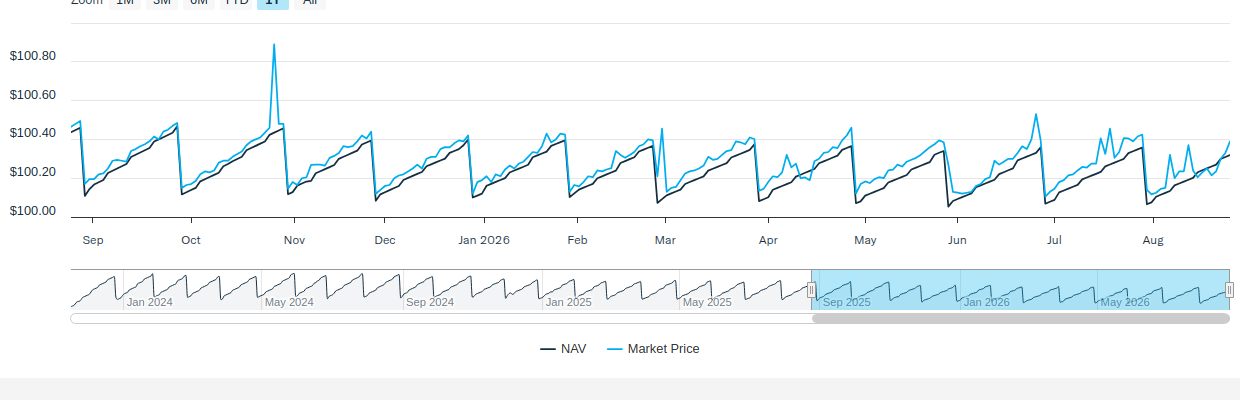
NAV/Market Price
| Previous Day's NAV | |
|---|---|
| Net Asset Value: | $100.32 |
| Daily Change: | $0.01 |
| % Daily Change: | 0.01% |
| 30-Day Median Bid/Ask Spread: | 0.02% |
| Previous Day's Market Price | |
|---|---|
| Closing Price: | $100.39 |
| Daily Change: | $0.06 |
| % Daily Change: | 0.06% |
| % Premium/Discount: | 0.07% |
Daily Price/NAV Performance
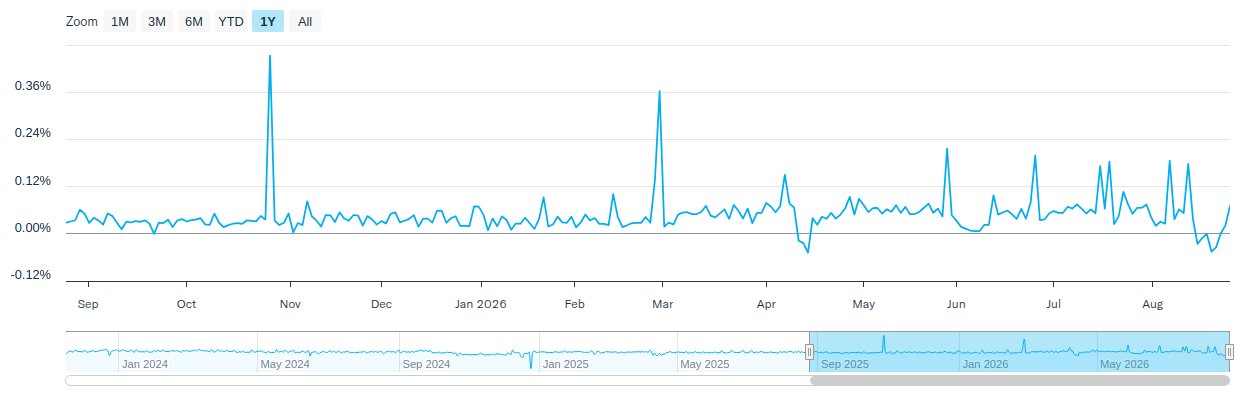
Premium/Discount
| 2025 | Q1 2026 | Q2 2026 | Q3 2026 | Q4 2026 | |
|---|---|---|---|---|---|
| Days Traded at Premium | 243 | 61 | 59 | - | - |
| Days Traded at NAV | 0 | 0 | 0 | - | - |
| Days Traded at Discount | 8 | 0 | 3 | - | - |
The table and line graph are provided to show the frequency at which the closing price of the Fund was at a premium (above) or discount (below) to the Fund’s daily net asset value (“NAV”). The table and line graph represent past performance and cannot be used to predict future results. Shareholders may pay more than NAV when buying Fund shares and receive less than an NAV when those shares are sold because shares are bought and sold at current market prices.
Literature
Fund Resources
Insights
What's Ahead? 2025 Second Half Market Outlook
July 24, 2025
Actionable Market Opportunities and Mid-Year Update
ETF Watch: Finding Income in Volatile Markets
March 17, 2025
Three Diverse Strategies for Compelling Income Streams
Rising Tariffs, Rising Opportunities: Finding the Path in Uncertain Times
March 10, 2025
Tariffs and the Importance of Proactive Portfolio Management. After a month-long pause, President Trump moved forward with increased tariffs and announced a series of measures that are likely to result in higher tariffs for a variety of products from a range of countries. These include:
How to Invest
Amplify ETFs trade throughout the day, similar to publicly-traded stocks, on an exchange. There are multiple ways to invest in Amplify ETFs:
- Contact a Financial Advisor to discover how Amplify ETFs may fit within your portfolio.
- Amplify ETFs are available through various online platforms and brokerage accounts.
Connect with your ETF Specialist or call (855) 267-3837
Investing involves risk, including the possible loss of principal. You could lose money by investing in the Fund. There can be no assurance that the Fund’s investment objectives will be achieved. The Fund is new with limited history to evaluate. There is no assurance that SOFR, or rates derived from SOFR, will perform in the same or similar way as other more established rates would have performed at any time. The Fund’s use of financial instruments involving counterparties, including swap arrangements, involves risks that are different from those associated with ordinary portfolio securities transactions. The Fund expects to invest principally in repos (Repurchase Agreements). If the seller fails to repurchase the security and the market value of the security declines, the Fund may lose money.
There is risk that the value of assets or income from investments will be less in the future as inflation decreases the value of money. The Fund may hold certain investments that may trade over-the-counter, trade in limited volume, or lack an active trading market. The Fund is subject to management risk because it is an actively managed portfolio. The Fund currently has fewer assets than larger funds, and like other new funds, large inflows and outflows may impact the Fund’s market exposure for limited periods of time. Because the Fund is non-diversified, it can invest a greater portion of its assets in securities of individual issuers so that changes in the market value could cause greater fluctuations in Share price than would occur in a diversified fund.
Amplify Investments LLC is the Investment Adviser to the Fund, and Samsung Asset Management (New York), Inc. serves as the Investment Sub-Adviser.