

Fund Details
| Ticker | TKNQ |
| Launch Date | 12/23/2025 |
| Primary Exchange | NYSE Arca |
| CUSIP | 032108367 |
| Net Assets | N/A |
| Shares Outstanding | N/A |
| # of Holdings (view all holdings) | N/A |
| Total Expense Ratio: | 0.69% |
Fund Characteristics
| Weighted Avg. Market Cap | N/A |
| Price-to-earnings | N/A |
| Price-to-book | N/A |
| Standard deviation | N/A |
Standard deviation measures how dispersed returns are around the average. A higher standard deviation indicates that returns are spread out over a larger range of values and thus, more volatile.
Index Details
| Index Name | MarketVectorTM Tokenization Technology Index |
| Index Ticker | MVTKNQ |
| Index Provider | MarketVectorTM |
| Weighting Methodology | Proprietary |
| Rebalance Frequency | Quarterly |
| Index Website | marketvector.com |
Fund Documents
Insights
Why Invest in TKNQ?
- Trillion-Dollar Transformation: The tokenized assets are projected to grow from $176 billion to over $3.6 trillion by 2030, driven by adoption from major financial institutions and regulatory tailwinds.1
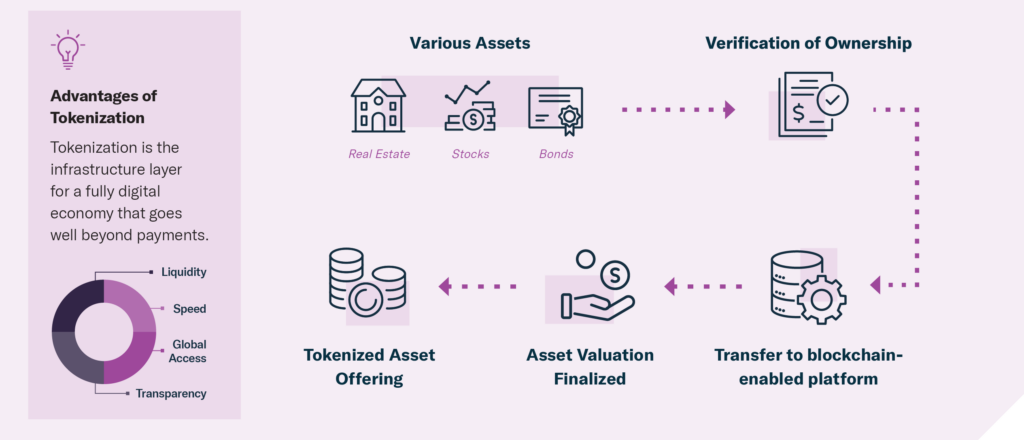
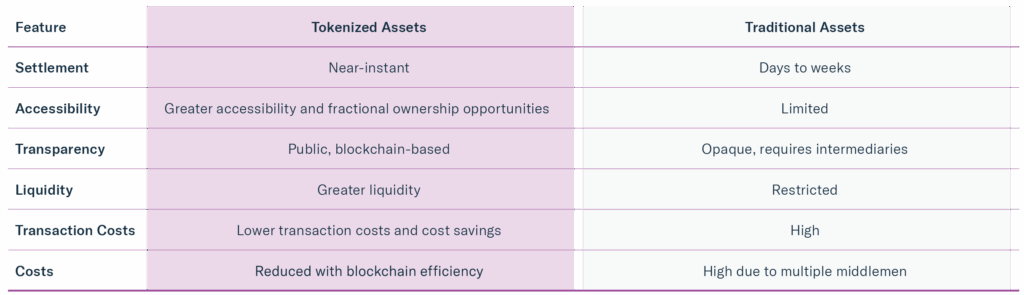
- Infrastructure for the Digitization of All Assets: Tokenization connects real-world assets to digital platforms, enabling ownership verification, fractional investing, faster settlements, and broader access to traditionally hard-to-trade assets—enhancing liquidity, accessibility, and efficiency.
- Diversified Exposure to Tokenization Ecosystem: TKNQ provides equity and digital asset exposure to companies, blockchains, platforms and infrastructure providers driving tokenization across financial services, artificial intelligence, and next generation digital ecosystems.
Objective and Strategy
Amplify Tokenization Technology ETF (TKNQ) tracks a professionally constructed index that blends equities and cryptocurrencies shaping the new tokenization economy. By targeting companies and crypto assets with significant tokenization-driven revenue, innovation, or infrastructure impact, TKNQ aims to provide a streamlined, high-conviction approach to participating in this emerging digital asset frontier. The Fund seeks investment results that closely correspond (before fees and expenses) to the performance of the MarketVector™ Tokenization Technology Index.
This fund does not invest directly in digital assets.
NAV and Market Price
| Previous Day's NAV | Previous Day's Market Price | |||
|---|---|---|---|---|
| Net Asset Value | N/A | Closing Price | N/A | |
| Daily Change | N/A | Daily Change | N/A | |
| % Daily Change | N/A | % Daily Change | N/A | |
| 30-Day Median Bid/Ask Spread | N/A | Premium/Discount % | N/A | |
| Premium Discount History | ||||
Daily Price/NAV Performance
Fund Holdings
| TOP 10 HOLDINGS | |||
|---|---|---|---|
Fund holdings are subject to change at any time and should not be considered recommendations to buy or sell any security.
Selection Methodology
Starting Universe
Tokenization technology universe including companies and digital asset exchange traded products (ETPs).
Equity Criteria
Companies with Tokenization patents, technology, services or infrastructure and: Significant revenue or exposure in:
- Tokenization platforms and protocols
- Blockchain infrastructure
- Exchanges, custodians, and brokerages for tokenized assets
- Financial institutions with major tokenization initiatives
Crypto Asset Criteria
Exposure via digital asset ETPs supporting real-world asset tokenization in activities such as:
- Payments
- Smart Contract Platforms
- Infrastructure Applications
- Decentralized Finance & Exchanges
Final Portfolio
- At rebalance, ~50-75% equities (equal-weighted), ~25-50% digital asset ETPs based on index eligibility (asset-weighted).
- Securities must meet minimum market capitalization, investability, and liquidity requirements.
Tokenization allows real-world assets like real estate, stocks, and bonds to be represented as digital tokens on a blockchain network.
Tokenization vs Traditional Assets
Past performance is no guarantee of future results.
Thematic Allocation
Country Allocation
Market Capitalization
| LARGE CAP (> $10B): | N/A |
| MID CAP ($2B - $10B): | N/A |
| SMALL CAP ($300M - < $2B): | N/A |
Fund holdings are subject to change at any time and should not be considered recommendations to buy or sell any security.
Performance
| CUMULATIVE (%) | ANNUALIZED (%) | ||||||||
|---|---|---|---|---|---|---|---|---|---|
| 1 Mo. | 3 Mo. | 6 Mo. | YTD | Since Inception | 1 Yr. | 3 Yr. | 5 Yr. | Since Inception | |
| Month end as of TBD | |||||||||
| NAV | N/A | N/A | N/A | N/A | N/A | N/A | N/A | N/A | N/A |
| Closing Price | N/A | N/A | N/A | N/A | N/A | N/A | N/A | N/A | N/A |
| MarketVectorTM Tokenization Technology Index | N/A | N/A | N/A | N/A | N/A | N/A | N/A | N/A | N/A |
| Quarter end as of TBD | |||||||||
| NAV | N/A | N/A | N/A | N/A | N/A | N/A | N/A | N/A | N/A |
| Closing Price | N/A | N/A | N/A | N/A | N/A | N/A | N/A | N/A | N/A |
| MarketVectorTM Tokenization Technology Index | N/A | N/A | N/A | N/A | N/A | N/A | N/A | N/A | N/A |
Fund inception date: 12/22/2025. The performance data quoted represents past performance and does not guarantee future results. Investment return and principal value of an investment will fluctuate so that an investor's shares, when sold or redeemed, may be worth more or less than the original cost. Current performance may be lower or higher than the performance quoted. Brokerage commissions will reduce returns. NAV is the sum of all its assets less any liabilities, divided by the number of shares outstanding. The closing price is the last price at which the fund traded.
Indexes are unmanaged and it's not possible to invest directly in an index. MarketVector™ Tokenization Technology Index is a rules-based index comprised of companies and exchange-traded products (ETPs) that are engaged in the growth, commercialization, and broader proliferation of tokenization.
Premium/Discount
The table and line graph are provided to show the frequency at which the closing price of the Fund was at a premium (above) or discount (below) to the Fund's daily net asset value ("NAV"). The table and line graph represent past performance and cannot be used to predict future results. Shareholders may pay more than NAV when buying Fund shares and receive less than an NAV when those shares are sold because shares are bought and sold at current market prices.
This is your Counts mockup
| Q1 | Q2 | Q3 | Q4 | ||
|---|---|---|---|---|---|
| Days traded at premium | N/A | N/A | N/A | N/A | N/A |
| Days traded at net asset value | N/A | N/A | N/A | N/A | N/A |
| Days traded at discount | N/A | N/A | N/A | N/A | N/A |
1decrypt.co-real-world-asset-tokenization-ozean, cryptopolitan.com/bny-sees-stablecoins-hitting-3-6-t
Investing involves risk, including the possible loss of principal. There is no guarantee the investment strategy will be successful. The Fund is considered to be non-diversified.
The Fund employs a “passive management” or indexing investment approach that seeks investment results that correspond (before fees and expenses) generally to the performance of its underlying index.
Investments focused on tokenization and digital assets are more volatile than broadly diversified portfolios. Tokenization technology may not deliver expected returns and faces risks such as theft, cybersecurity, competition, and regulatory uncertainty.
The Fund may have indirect exposure to cryptocurrencies through other investment vehicles but does not invest directly in Bitcoin, Ethereum, XRP, or Solana. Cryptocurrency investments are highly speculative, subject to extreme volatility, and uncertain tax treatment.
The Fund’s return may not match or achieve a high degree of correlation with the return of the Index. To the extent the Fund utilizes a sampling approach, it may experience tracking error to a greater extent than if the Fund had sought to replicate the Index.
The MarketVector™ Tokenization Technology Index is a rules-based index comprised of companies and exchange-traded products (ETPs) that are engaged in the growth, commercialization, and broader proliferation of tokenization.
Amplify Investments LLC is the Investment Adviser to the Fund, and Penserra Capital Management serves as the Investment Sub-Adviser.
ETF Express Award Methodologies: https://etfexpress.com/issuer-methodology/