

Overview
Why Invest in BDRY ETF?
- The first and only freight futures exchange-traded product exclusively focusing on dry bulk shipping.1
- A pure-play exposure to dry bulk shipping, an instrumental part of the global commodity market, uncorrelated to other major assets.
- Strives to profit from increases in freight futures beyond what is already priced in the market.
Objective & Strategy
The Breakwave Dry Bulk Shipping ETF (BDRY) is an exchange-traded fund (ETF) designed to reflect the daily price movements of the near-dated dry bulk freight futures. BDRY offers investors unlevered exposure to dry bulk freight without the need for a futures account.
Key Information
Fund Details
| Ticker | BDRY |
| Launch Date | 03/22/2018 |
| Primary Exchange | NYSE Arca |
| CUSIP | 03210A107 |
| Net Assets | $32,292,549 |
| Shares Outstanding | 2,200,040 |
| Holdings (view all holdings) | 15 |
| Total Expense Ratio i | 3.50%2 |
Index Details
| Index Name | Breakwave Dry Freight Futures Index |
| Index Ticker | BDRYFF |
| Index Provider | Breakwave Advisors LLC |
| Weighting Methodology | Proprietary |
| Rebalance Frequency | Annual |
| Index Website | breakwaveadvisors.com |
Portfolio Allocation
- Freight Futures of one-to-six months forward
- Weighted average expiration of 60-70 days
- 50% Capesize 5TC
- 40% Panamax 4TC
- 10% Supramax 10TC
50% CAPESIZE 5TC
Largest standard dry bulk vessel, mainly used to transport iron ore
40% PANAMAX 4TC
Largest dry bulk vessel able to transit the Panama canal
10% SUPRAMAX 10TC
Medium size dry bulk ship with onboard cranes
Performance & Holdings
Performance
| Cumulative (%) | Annualized (%) | |||||||||
|---|---|---|---|---|---|---|---|---|---|---|
| 1MO | 3MO | 6MO | YTD | Since Inception | 1YR | 3YR | 5YR | 10YR | Since Inception | |
| NAV | 11.34% | 16.70% | 17.15% | 54.36% | -46.02% | 81.16% | 39.72% | -12.33% | — | -7.11% |
| Closing Price | 13.06% | 14.51% | 16.39% | 53.02% | -46.32% | 81.35% | 39.44% | -12.25% | — | -7.17% |
| Cumulative (%) | Annualized (%) | |||||||||
|---|---|---|---|---|---|---|---|---|---|---|
| 1MO | 3MO | 6MO | YTD | Since Inception | 1YR | 3YR | 5YR | 10YR | Since Inception | |
| NAV | -6.46% | 20.15% | 38.64% | 38.64% | -51.52% | 115.47% | 29.96% | -15.94% | — | -8.38% |
| Closing Price | -8.27% | 19.06% | 35.35% | 35.35% | -52.52% | 113.87% | 28.84% | -16.56% | — | -8.61% |
The performance data quoted represents past performance and does not guarantee future results. Investment return and principal value of an investment will fluctuate so that an investor’s shares, when sold or redeemed, may be worth more or less than the original cost. Current performance may be lower or higher than the performance quoted. Brokerage commissions will reduce returns. NAV is the sum of all its assets less any liabilities, divided by the number of shares outstanding. The closing price is the last price at which the fund traded.
Extraordinary performance is attributable in part to unusually favorable market conditions and may not be repeated or consistently achieved in the future.
Top 10 Holdings
| Name | Ticker | Market Value (%) | CUSIP | Shares | Market Value ($) |
|---|---|---|---|---|---|
| Capesize 5TC FFA 180kt Timecharter Average M Sep 26 | C5TCM U26 INDEX | 20.47% | C5TCM U26 | 155 | $6,609,665 |
| Capesize 5TC FFA 180kt Timecharter Average M Aug 26 | C5TCM Q26 INDEX | 19.04% | C5TCM Q26 | 155 | $6,149,625 |
| Panamax 5TC FFA 82kt Timecharter Average M Sep 26 | P5TCM U26 INDEX | 13.51% | P5TCM U26 | 205 | $4,363,630 |
| Panamax 5TC FFA 82kt Timecharter Average M Aug 26 | P5TCM Q26 INDEX | 12.56% | P5TCM Q26 | 205 | $4,055,310 |
| Capesize 5TC FFA 180kt Timecharter Average M Oct 26 | C5TCM V26 INDEX | 8.15% | C5TCM V26 | 60 | $2,630,580 |
| Capesize 5TC FFA 180kt Timecharter Average M Nov 26 | C5TCM X26 INDEX | 7.82% | C5TCM X26 | 60 | $2,523,840 |
| Capesize 5TC FFA 180kt Timecharter Average M Dec 26 | C5TCM Z26 INDEX | 7.45% | C5TCM Z26 | 60 | $2,405,160 |
| Panamax 5TC FFA 82kt Timecharter Average M Oct 26 | P5TCM V26 INDEX | 6.95% | P5TCM V26 | 100 | $2,243,200 |
| Panamax 5TC FFA 82kt Timecharter Average M Nov 26 | P5TCM X26 INDEX | 6.82% | P5TCM X26 | 100 | $2,201,400 |
| Panamax 5TC FFA 82kt Timecharter Average M Dec 26 | P5TCM Z26 INDEX | 6.41% | P5TCM Z26 | 100 | $2,070,700 |
Fund holdings are subject to change at any time and should not be considered recommendations to buy or sell any security.
Allocation
Distributions
There is no guarantee that distributions will be made.
Price
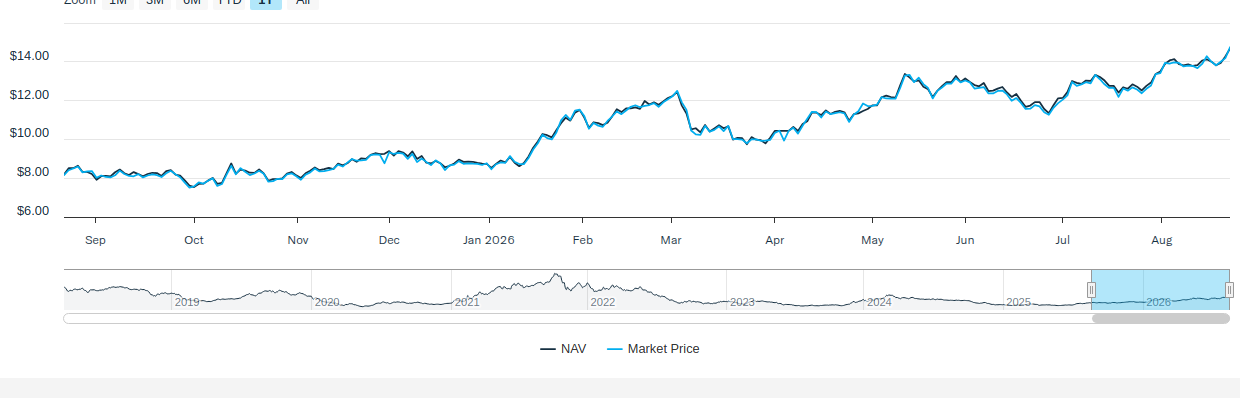
NAV/Market Price
| Previous Day's NAV | |
|---|---|
| Net Asset Value: | $14.68 |
| Daily Change: | $0.41 |
| % Daily Change: | 2.84% |
| 30-Day Median Bid/Ask Spread: | 0.95% |
| Previous Day's Market Price | |
|---|---|
| Closing Price: | $14.75 |
| Daily Change: | $0.56 |
| % Daily Change: | 3.95% |
| % Premium/Discount: | 0.49% |
Daily Price/NAV Performance
Premium/Discount
| 2025 | Q1 2026 | Q2 2026 | Q3 2026 | Q4 2026 | |
|---|---|---|---|---|---|
| Days Traded at Premium | 105 | 21 | 14 | - | - |
| Days Traded at NAV | 0 | 0 | 0 | - | - |
| Days Traded at Discount | 146 | 40 | 48 | - | - |
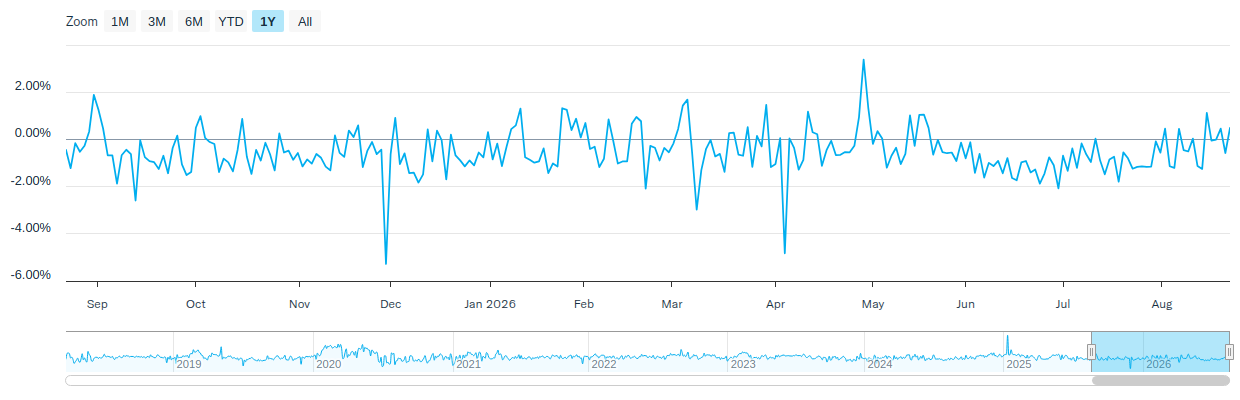
The table and line graph are provided to show the frequency at which the closing price of the Fund was at a premium (above) or discount (below) to the Fund’s daily net asset value (“NAV”). The table and line graph represent past performance and cannot be used to predict future results. Shareholders may pay more than NAV when buying Fund shares and receive less than an NAV when those shares are sold because shares are bought and sold at current market prices.
Literature
Insights
International Insights: Investing Across the Globe - August 2026
August 12, 2026
Audio Commentary by Tim Seymour, IDVO Portfolio Manager
International Insights: Investing Across the Globe - May 2026
June 8, 2026
Audio Commentary by Tim Seymour, IDVO Portfolio Manager
Climate Capital: The Case for ESG Investing
May 22, 2026
In an era where climate change debates heat the political sphere, many savvy business owners and investors are turning their focus toward a cooler, more sustainable future.
How to Invest
Amplify ETFs trade throughout the day, similar to publicly-traded stocks, on an exchange. There are multiple ways to invest in Amplify ETFs:
- Contact a Financial Advisor to discover how Amplify ETFs may fit within your portfolio.
- Amplify ETFs are available through various online platforms and brokerage accounts.
Connect with your ETF Specialist or call (855) 267-3837
1First-to-market claim is based on a review of industry data as of March 22, 2018. No information to the contrary has come to our attention to date, for more information or inquiries about this claim, please contact info@amplifyetfs.com
2Breakwave has agreed to waive its fee and the Sponsor has agreed to assume the Fund’s Other Expenses (which term excludes brokerage fees, interest expenses, and extraordinary expenses) so that the Fund’s total annual expenses do not exceed 3.50% per annum through December 31, 2026 after which the expense limitation may be terminated and Fund shareholders may incur expenses higher than 3.50% annually, perhaps significantly higher.
The Fund is not a mutual fund or any other type of investment company within the meaning of the Investment Company Act of 1940, as amended, and is not subject to regulation thereunder.
An investment in the Fund involves significant risks. You could lose all or part of your investment in the Fund, and the Fund’s performance could trail that of other investments.
The Fund invests solely in Freight Futures. Such concentration may result in a high degree of volatility in the net asset value of the Fund under specific market conditions and over time. Futures are speculative and the value of the Shares of the Fund relates directly to the value of, and realized profit or loss from, the Freight Futures and other assets held by the Fund, and fluctuations in price could materially affect the Fund’s shares.
Investments in freight futures typically fluctuate in value with changes in spot charter rates. Charter rates for dry bulk vessels are volatile and have declined significantly since their historic highs and may remain at low levels or decrease further in the future. The Fund will not take defensive positions to protect against declining freight rates, which could cause a decline to the value of the Fund’s shares.
Although the Fund’s shares are listed and traded on the NYSE Arca, there can be no guarantee that an active trading market for the shares will be maintained. If an investor needs to sell shares at a time when no active trading market for them exists, the price the investor receives upon sale of the shares, assuming they were able to be sold, likely would be lower than if an active market existed.
Breakwave Advisors LLC (“Breakwave”) is a registered “commodity trading advisor” with the NFA and will act as such for the Fund. Breakwave specializes in shipping and freight investments.
Amplify Investments LLC, the Sponsor, serves as the “commodity pool operator” to the Fund and is registered in such capacity with the NFA.
Amplify ETFs are distributed by Foreside Fund Services, LLC.