
| 12.15% |
| Distribution Rate i Distribution Rate is the normalized current distribution (annualized) over NAV per share. Distributions may include return of capital (ROC). Click on "All Distributions→" to view Form 19a-1. |
| 4.32% |
| 30-Day SEC Yield i 30-Day SEC Yield is a standard yield calculation developed by the Securities and Exchange Commission that allows for fairer comparisons among bond funds. It is based on the most recent month end. This figure reflects the income earned from dividends – excluding option income – during the period after deducting the Fund’s expenses for the period. |
| Monthly |
| Distribution Frequency |
Overview
Why Invest in LQDM ETF?
- High Targeted Income: LQDM targets 12% annualized income through option premium income1 and interest from investment‑grade bonds.
- Total Return Focus: LQDM aims to deliver attractive total return by combining consistent premium income from weekly covered calls with upside potential from shares not covered by calls.
- Enhanced Portfolio Resilience: Higher credit quality exposure to over 2,000 investment grade bonds, via the underlying investment, helps support more stable income and historically lower volatility across market environments.
Objective & Strategy
Targeting high income and capital appreciation potential, LQDM offers portfolio diversification by combining weekly covered calls with investment‑grade bond exposure in a single ticker. The Amplify LQD Investment Grade 12% Target Income ETF seeks investment results that generally correlate to the performance (before fees and expenses) of the Bloomberg U.S. Investment Grade Corporate Bond 12% Income Covered Call Index.
Target Income may not be achieved, and income may be significantly below that level during any one year period if NAV remains level or declines. Distributions are not guaranteed.
YieldSmart™ ETFs
Key Information
Fund Details
| Ticker | LQDM |
| Launch Date | 04/21/2026 |
| Primary Exchange | Cboe BZX |
| CUSIP | 032108326 |
| Net Assets | $2,637,122 |
| Shares Outstanding | 110,000 |
| Holdings (view all holdings) | 2 |
Fees & Expenses
| Management Fee | 0.40% |
| Acquired Fund Fees & Expenses | 0.14%iEstimated based on expected expenses for the current fiscal year. |
| Total Expense Ratio | 0.54%iAs of most recent prospectus |
Index Details
| Index Name | Bloomberg U.S. Investment Grade Corporate Bond 12% Income Covered Call Index |
| Index Ticker | BTSICTLQ |
| Index Provider | Bloomberg |
| Rebalance Frequency | Weekly Options Roll |
| Index Website | Bloomberg.com |
Targeted High-Income Covered Call Construction
Target 12% Income Annually
Buy
Buy investment grade corporate bonds through LQD.
Write
Sell weekly call options on LQD, selling only enough calls to generate a total of 12% annual income from option premiums and interest income.
Roll
On a weekly basis, replace expiring covered call option with the new one (roll) to help generate ongoing option premiums.
Distribute
LQDM seeks to pay monthly distributions that include both the option income premiums and the underlying LQD dividends.
Performance & Holdings
Performance
| Cumulative (%) | Annualized (%) | |||||||||
|---|---|---|---|---|---|---|---|---|---|---|
| 1MO | 3MO | 6MO | YTD | Since Inception | 1YR | 3YR | 5YR | 10YR | Since Inception | |
| NAV | -1.70% | -0.97% | — | — | -1.82% | — | — | — | — | — |
| Closing Price | -1.87% | -0.97% | — | — | -1.84% | — | — | — | — | — |
| Bloomberg U.S. Investment Grade Corporate Bond 12% Income Covered Call Index | -1.70% | -0.88% | — | — | -1.76% | — | — | — | — | — |
| Cumulative (%) | Annualized (%) | |||||||||
|---|---|---|---|---|---|---|---|---|---|---|
| 1MO | 3MO | 6MO | YTD | Since Inception | 1YR | 3YR | 5YR | 10YR | Since Inception | |
| NAV | 0.26% | — | — | — | -0.12% | — | — | — | — | — |
| Closing Price | 0.25% | — | — | — | 0.03% | — | — | — | — | — |
| Bloomberg U.S. Investment Grade Corporate Bond 12% Income Covered Call Index | 0.19% | — | — | — | -0.06% | — | — | — | — | — |
The performance data quoted represents past performance and does not guarantee future results. Investment return and principal value of an investment will fluctuate so that an investor’s shares, when sold or redeemed, may be worth more or less than the original cost. Current performance may be lower or higher than the performance quoted. Brokerage commissions will reduce returns. NAV is the sum of all its assets less any liabilities, divided by the number of shares outstanding. The closing price is the last price at which the fund traded.
Indexes are unmanaged and it’s not possible to invest directly in an index. Bloomberg U.S. Investment Grade Corporate Bond 12% Income Covered Call Index is designed to provide exposure to U.S. investment grade corporate bonds and generate 12% income through interest payments and option premiums.
Top Strategic Holdings
| Name | Ticker | Market Value (%) | CUSIP | Shares | Market Value ($) |
|---|---|---|---|---|---|
| iShares iBoxx USD Investment Grade Corporate Bond ETF | LQD | 99.84% | 464287242 | 24,662 | $2,632,915 |
| LQD 08/07/2026 105.87 C | 4LQD 260807C00105870 | -0.36% | 4LQD 260807C00105870 | -95 | $-9,466 |
Fund holdings are subject to change at any time and should not be considered recommendations to buy or sell any security.
Allocation
Distributions & Yields
Distributions
| Ex-Date | Record Date | Payable Date | Amount (USD) |
|---|---|---|---|
| 05/28/2026 | 05/28/2026 | 05/29/2026 | $0.24820 |
| 06/29/2026 | 06/29/2026 | 06/30/2026 | $0.24780 |
| 07/30/2026 | 07/30/2026 | 07/31/2026 | $0.24120 |
| 08/28/2026 | 08/28/2026 | 08/31/2026 | — |
| 09/29/2026 | 09/29/2026 | 09/30/2026 | — |
| 10/29/2026 | 10/29/2026 | 10/30/2026 | — |
| 11/27/2026 | 11/27/2026 | 11/30/2026 | — |
| 12/30/2026 | 12/30/2026 | 12/31/2026 | — |
Yields
| Distribution Rate | 12.15% | 30-Day SEC Yield | 4.32% |
| Distribution Frequency | Monthly |
There is no guarantee that distributions will be made. Distributions may include income, capital gains, or return of capital and may vary during the year, details in the Fund’s Form 19a‑1.
Price
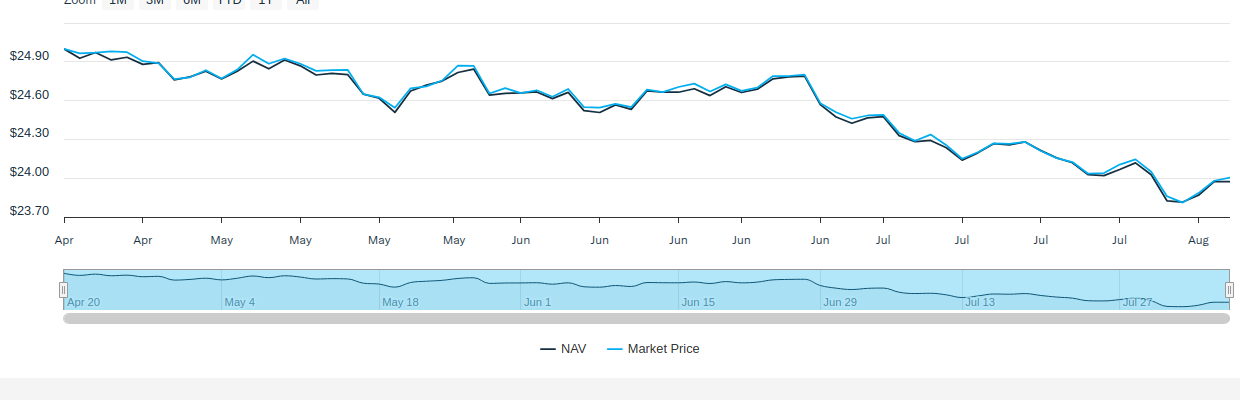
NAV/Market Price
| Previous Day's NAV | |
|---|---|
| Net Asset Value: | $23.97 |
| Daily Change: | $0.11 |
| % Daily Change: | 0.44% |
| 30-Day Median Bid/Ask Spread: | 0.25% |
| Previous Day's Market Price | |
|---|---|
| Closing Price: | $23.98 |
| Daily Change: | $0.10 |
| % Daily Change: | 0.40% |
| % Premium/Discount: | 0.03% |
Daily Price/NAV Performance
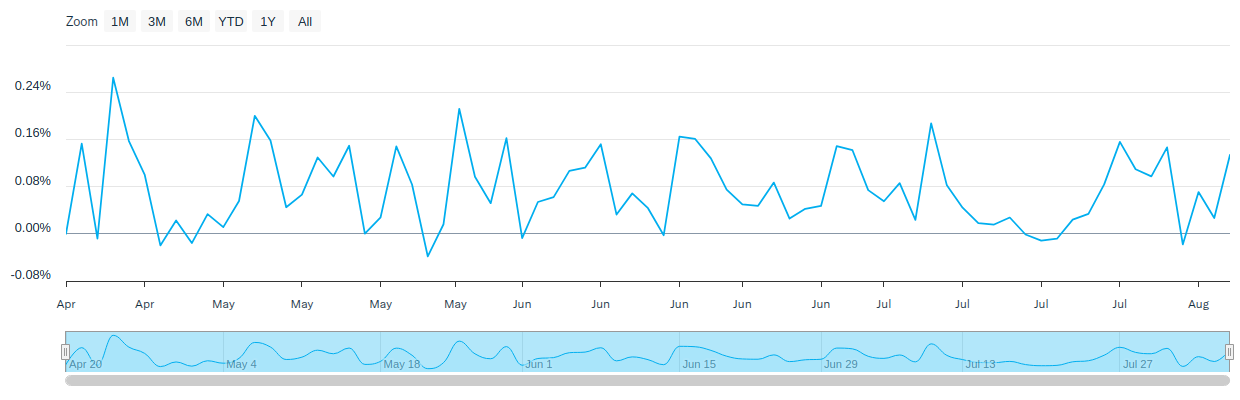
Premium/Discount
| 2025 | Q1 2026 | Q2 2026 | Q3 2026 | Q4 2026 | |
|---|---|---|---|---|---|
| Days Traded at Premium | - | - | 43 | - | - |
| Days Traded at NAV | - | - | 1 | - | - |
| Days Traded at Discount | - | - | 6 | - | - |
The table and line graph are provided to show the frequency at which the closing price of the Fund was at a premium (above) or discount (below) to the Fund’s daily net asset value (“NAV”). The table and line graph represent past performance and cannot be used to predict future results. Shareholders may pay more than NAV when buying Fund shares and receive less than an NAV when those shares are sold because shares are bought and sold at current market prices.
Literature
Fund Resources
Regulatory Resources
Insights
International Insights: Investing Across the Globe - May 2026
June 8, 2026
Audio Commentary by Tim Seymour, IDVO Portfolio Manager
Climate Capital: The Case for ESG Investing
May 22, 2026
In an era where climate change debates heat the political sphere, many savvy business owners and investors are turning their focus toward a cooler, more sustainable future.
The Digital Economy Is Built on Real Assets
May 20, 2026
Artificial intelligence and the digital economy are driving unprecedented demand for electricity and critical materials—creating a new energy supercycle.
How to Invest
Amplify ETFs trade throughout the day, similar to publicly-traded stocks, on an exchange. There are multiple ways to invest in Amplify ETFs:
- Contact a Financial Advisor to discover how Amplify ETFs may fit within your portfolio.
- Amplify ETFs are available through various online platforms and brokerage accounts.
Connect with your ETF Specialist or call (855) 267-3837
1An option premium is the cost an option buyer pays to the seller for the right to trade an asset at a set price within a certain period.
2At the money call options prioritize income from option premiums with potential growth if the underlying isn’t called away.
There is no guarantee that the Fund will meet its investment objective. The Fund is not actively managed and the Fund’s return may not match or achieve a high degree of correlation with the return of the Index. The Fund is non‑diversified and may be concentrated, which can increase volatility. The Fund is subject to market risk, interest rate risk, inflation risk, credit risk, underlying fund risk, and risks associated with high-yield bonds. Rising interest rates generally reduce the value of fixed income investments.
Covered call strategies may limit upside potential while still exposing the Fund to downside risk.
Covered puts can incur substantial losses if the underlying asset rises sharply, with premiums offering limited protection. The use of FLEX Options and other derivatives involves additional risks. Monthly distributions may include return of capital, which lowers the investor’s cost basis and could result in higher loss.
The Bloomberg U.S. Investment Grade Corporate Bond 12% Income Covered Call Index is designed to provide exposure to U.S. investment grade corporate bonds and generate 12% income through interest payments and option premiums.
Investment advisor: Amplify Investments LLC; Sub-Adviser: Samsung Asset Management (New York), Inc.