

Overview
★★★★
Overall Morningstar RatingTM
Based on risk adjusted returns among 241 funds in the Technology category (as of 10/31/26).
Why Invest in HACK ETF?
- Significant Growth Opportunity: Projected at $454 billion in 2025, the global cybersecurity market is expected to hit over $1 trillion by 2031, expanding at nearly a 15% CAGR.1
- Defense Spending on Cybersecurity Is Growing Significantly: The overall DoD cyber budget requests grew ~29.5% between FY2023 and FY2025.2
- The Interconnected World: The increasing interconnectedness of the world through technology has led to a rising demand for robust security measures.
Objective & Strategy
HACK seeks investment results that generally correlate (before fees and expenses) to the total return performance of the Nasdaq ISE Cyber Security™ Select Index. HACK tracks a portfolio of companies actively involved in providing cybersecurity solutions that include hardware, software, and services.
First Cybersecurity ETF
Launched in 2014, HACK is the first cybersecurity ETF to provide a way to cost-effectively invest in companies within the growing cybersecurity industry.3
Key Information
Fund Details
| Ticker | HACK |
| Launch Date | 11/11/2014 |
| Primary Exchange | NYSE Arca |
| CUSIP | 032108664 |
| Net Assets | $3,352,555,561 |
| Shares Outstanding | 29,100,000 |
| Holdings (view all holdings) | 23 |
| Total Expense Ratio i | 0.60% |
Index Details
| Index Name | ISE Cyber Security™ Select Index |
| Index Ticker | HXRXL |
| Index Provider | Nasdaq, Inc. |
| Weighting Methodology | Adjusted Market Cap |
| Rebalance Frequency | Quarterly |
| Index Website | Nasdaq Global Indexes |
Performance & Holdings
Performance
| Cumulative (%) | Annualized (%) | |||||||||
|---|---|---|---|---|---|---|---|---|---|---|
| 1MO | 3MO | 6MO | YTD | Since Inception | 1YR | 3YR | 5YR | 10YR | Since Inception | |
| NAV | 3.05% | 16.51% | 57.18% | 55.17% | 420.69% | 42.42% | 34.82% | 13.83% | 17.14% | 14.78% |
| Closing Price | 2.66% | 16.56% | 57.06% | 54.87% | 420.05% | 42.18% | 34.83% | 13.77% | 17.14% | 14.77% |
| Nasdaq ISE Cyber Security Select Total Return Index | 3.10% | 16.65% | 57.73% | 55.95% | — | 43.25% | — | — | — | — |
| Cumulative (%) | Annualized (%) | |||||||||
|---|---|---|---|---|---|---|---|---|---|---|
| 1MO | 3MO | 6MO | YTD | Since Inception | 1YR | 3YR | 5YR | 10YR | Since Inception | |
| NAV | 3.50% | 15.30% | 61.39% | 50.58% | 405.28% | 39.41% | 33.01% | 14.84% | 16.21% | 14.60% |
| Closing Price | 3.65% | 15.54% | 61.46% | 50.85% | 406.56% | 39.78% | 33.10% | 14.95% | 16.25% | 14.63% |
| Nasdaq ISE Cyber Security Select Total Return Index | 3.50% | 15.45% | 61.96% | 51.25% | — | 40.23% | — | — | — | — |
The performance data quoted represents past performance and does not guarantee future results. Investment return and principal value of an investment will fluctuate so that an investor’s shares, when sold or redeemed, may be worth more or less than the original cost. Current performance may be lower or higher than the performance quoted. Brokerage commissions will reduce returns. NAV is the sum of all its assets less any liabilities, divided by the number of shares outstanding. The closing price is the last price at which the fund traded.
Indexes are unmanaged and it’s not possible to invest directly in an index. The Nasdaq ISE Cyber Security™ Select Index (HXRXL) is designed to track companies involved in cybersecurity technology and services.
Extraordinary performance is attributable in part to unusually favorable market conditions and may not be repeated or consistently achieved in the future.
Top 10 Holdings
| Name | Ticker | Market Value (%) | CUSIP | Shares | Market Value ($) |
|---|---|---|---|---|---|
| Broadcom Inc | AVGO | 6.05% | 11135F101 | 674,562 | $205,343,418 |
| Crowdstrike Holdings Inc | CRWD | 5.70% | 22788C105 | 843,080 | $193,436,275 |
| Palo Alto Networks Inc | PANW | 5.34% | 697435105 | 527,330 | $181,042,936 |
| Netskope Inc | NTSK | 5.32% | 64119N608 | 7,540,476 | $180,443,591 |
| Cisco Systems Inc | CSCO | 5.08% | 17275R102 | 1,901,326 | $172,336,189 |
| Northrop Grumman Corp | NOC | 4.94% | 666807102 | 313,770 | $167,650,449 |
| Okta Inc | OKTA | 4.81% | 679295105 | 851,634 | $163,053,846 |
| Rubrik Inc | RBRK | 4.74% | 781154109 | 1,508,086 | $160,958,019 |
| General Dynamics Corp | GD | 4.68% | 369550108 | 465,357 | $158,919,416 |
| Cloudflare Inc | NET | 4.63% | 18915M107 | 571,713 | $157,198,206 |
Fund holdings are subject to change at any time and should not be considered recommendations to buy or sell any security.
Allocation
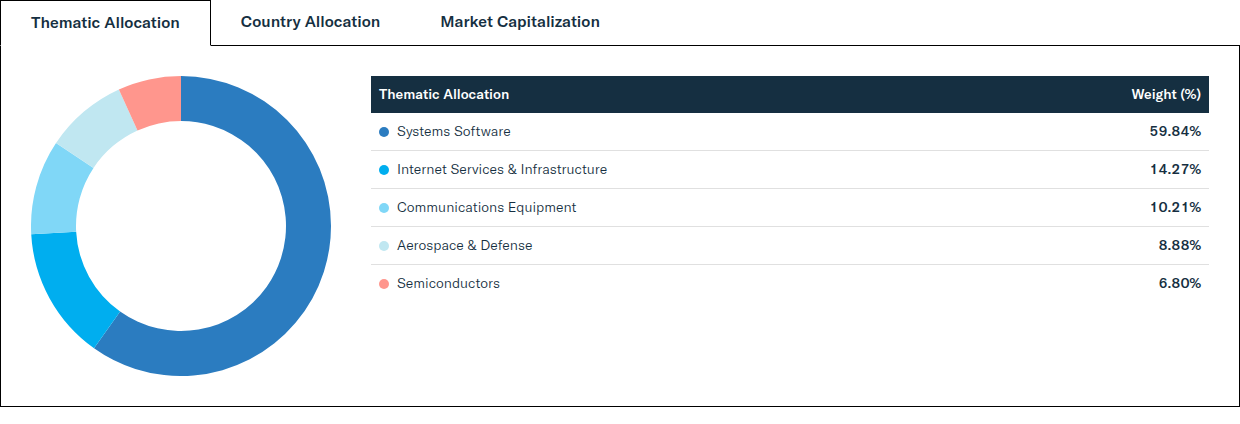
| Thematic Allocation | Weight (%) |
|---|---|
| Systems Software | 59.84% |
| Internet Services & Infrastructure | 14.27% |
| Communications Equipment | 10.21% |
| Aerospace & Defense | 8.88% |
| Semiconductors | 6.80% |
| Market Capitalization | Weight (%) |
|---|---|
| Large Capitalization (> $10B) | 69.18% |
| Mid Capitalization ($2B - $10B) | 24.97% |
| Small Capitalization ($300M - < $2B) | 5.85% |
| Country Allocation | Weight (%) |
|---|---|
| United States | 89.89% |
| Israel | 6.30% |
| Japan | 3.81% |
Distributions
| Ex-Date | Record Date | Payable Date | Amount (USD) |
|---|---|---|---|
| 12/30/2026 | 12/30/2026 | 12/31/2026 | — |
There is no guarantee that distributions will be made.
Price
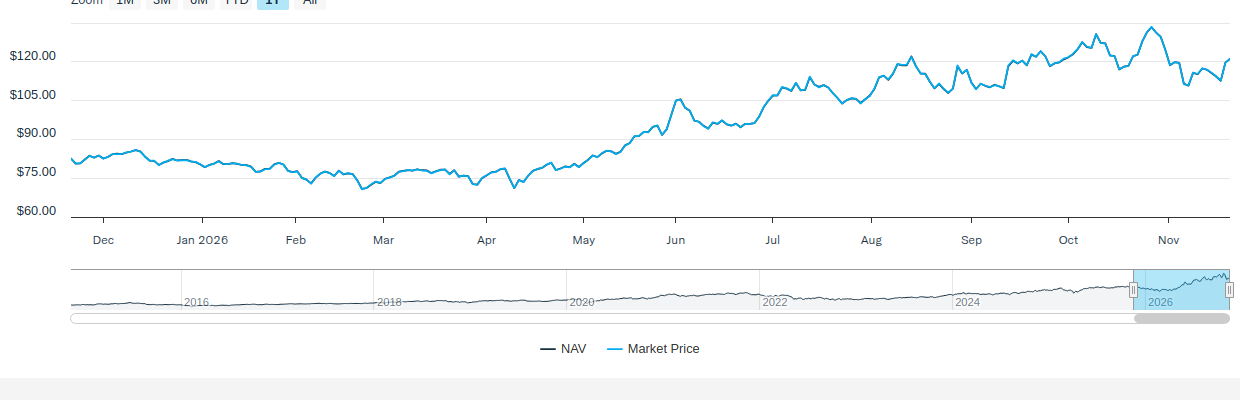
NAV/Market Price
| Previous Day's NAV | |
|---|---|
| Net Asset Value: | $115.21 |
| Daily Change: | $-5.93 |
| % Daily Change: | -4.89% |
| 30-Day Median Bid/Ask Spread: | 0.14% |
| Previous Day's Market Price | |
|---|---|
| Closing Price: | $115.30 |
| Daily Change: | $-5.94 |
| % Daily Change: | -4.90% |
| % Premium/Discount: | 0.08% |
Daily Price/NAV Performance
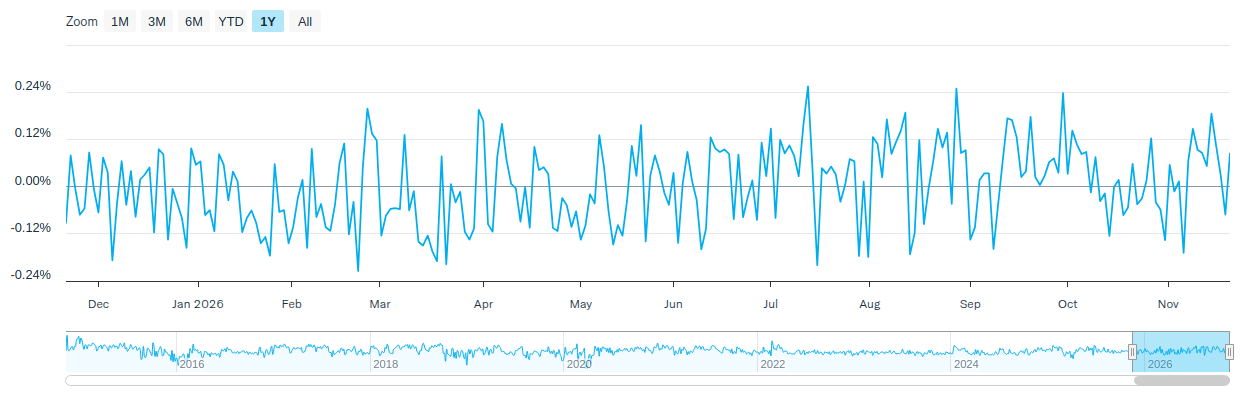
Premium/Discount
| 2025 | Q1 2026 | Q2 2026 | Q3 2026 | Q4 2026 | |
|---|---|---|---|---|---|
| Days Traded at Premium | 122 | 18 | 30 | 50 | - |
| Days Traded at NAV | 0 | 0 | 0 | 0 | - |
| Days Traded at Discount | 129 | 43 | 32 | 14 | - |
The table and line graph are provided to show the frequency at which the closing price of the Fund was at a premium (above) or discount (below) to the Fund’s daily net asset value (“NAV”). The table and line graph represent past performance and cannot be used to predict future results. Shareholders may pay more than NAV when buying Fund shares and receive less than an NAV when those shares are sold because shares are bought and sold at current market prices.
Literature
Fund Resources
Insights
Market Volatility Playbook, ETF Watch
November 17, 2026
Discover Strategies to Navigate Volatility, Participate & Help Cushion the Ride
International Insights: Investing Across the Globe - October 2026
November 10, 2026
Audio Commentary by Tim Seymour, IDVO Portfolio Manager
Equities Enter a Historically Favorable Stretch of the Presidential Cycle
November 5, 2026
Since 1950, the three-quarter period beginning in the fourth quarter of a midterm year has historically produced some of the strongest returns in the presidential cycle, despite periodic pullbacks.
How to Invest
Amplify ETFs trade throughout the day, similar to publicly-traded stocks, on an exchange. There are multiple ways to invest in Amplify ETFs:
- Contact a Financial Advisor to discover how Amplify ETFs may fit within your portfolio.
- Amplify ETFs are available through various online platforms and brokerage accounts.
Connect with your ETF Specialist or call (855) 267-3837
1https://www.einnews.com/pr_news/807326191/global-security-market-to-reach-1-trillion-annually-by-2031. CAGR is the compound annual growth rate
2Congressional Research Service, FY2026 Department of Defense Cyber Budget Request, 2025.
3First-to-market claim is based on a review of industry data as of November 11, 2014. No information to the contrary has come to our attention. For more information or inquiries about this claim, please contact info@amplifyetfs.com
Investing involves risk, including the possible loss of principal. Shares of any ETF are bought and sold at market price (not NAV), may trade at a discount or premium to NAV and are not individually redeemed from the Fund. Brokerage commissions will reduce returns. Narrowly focused investments typically exhibit higher volatility. The fund is concentrated in technology-related companies that face intense competition, both domestically and internationally, which may have an adverse effect on profit margins. Such companies may have limited product lines, markets, financial resources or personnel. The products of such companies may face obsolescence due to rapid technological developments, frequent new product introduction, unpredictable changes in growth rates, competition for the services of qualified personnel, and competition from foreign competitors with lower production costs. Technology companies are heavily dependent on patent and intellectual property rights. The loss or impairment of these rights may adversely affect the profitability of these companies.
Investments in foreign securities involve political, economic and currency risks, greater volatility and differences in accounting methods. The Funds are non-diversified, meaning they may concentrate its assets in fewer individual holdings than a diversified fund. Investments in smaller companies tend to have limited liquidity and greater price volatility than large-capitalization companies.
The Fund’s return may not match or achieve a high degree of correlation with the return of the Index. To the extent the Fund utilizes a sampling approach, it may experience tracking error to a greater extent than if the Fund had sought to replicate the Index.
© 2026 Morningstar, Inc. All rights reserved. The information contained herein: (1) is proprietary to Morningstar and/or its content providers; (2) may not be copied or distributed; and (3) is not warranted to be accurate, complete, or timely. Neither Morningstar nor its content providers are responsible for any damages or losses arising from any use of this information. Past performance is no guarantee of future results.
The Morningstar Rating™ for funds, or “star rating”, is calculated for managed products (including mutual funds, variable annuity and variable life subaccounts, exchange-traded funds, closed-end funds, and separate accounts) with at least a three-year history. Exchange-traded funds and open-ended mutual funds are considered a single population for comparative purposes. It is calculated based on a Morningstar Risk-Adjusted Return measure that accounts for variation in a managed product’s monthly excess performance, placing more emphasis on downward variations and rewarding consistent performance. The Morningstar Rating does not include any adjustment for sales loads. The top 10% of products in each product category receive 5 stars, the next 22.5% receive 4 stars, the next 35% receive 3 stars, the next 22.5% receive 2 stars, and the bottom 10% receive 1 star. The Overall Morningstar Rating for a managed product is derived from a weighted average of the performance figures associated with its three-, five-, and 10-year (if applicable) Morningstar Rating metrics. The weights are: 100% three-year rating for 36-59 months of total returns, 60% five-year rating/40% three-year rating for 60-119 months of total returns, and 50% 10-year rating/30% five-year rating/20% three-year rating for 120 or more months of total returns. While the 10-year overall star rating formula seems to give the most weight to the 10-year period, the most recent three-year period actually has the greatest impact because it is included in all three rating periods. HACK received 4 stars among 241 funds in the Technology category for the overall, 5 stars among 241 funds for the 3-year, 4 stars among 222 funds for the 5-year, and 3 stars among 158 funds for the 10-year period ending 10/31/26.
Amplify Investments LLC is the Investment Adviser to the Fund, and Penserra Capital Management LLC serves as the Investment Sub-Adviser.