

Overview
Why Invest in AHBM ETF?
- Focus on Market Leaders: Provides concentrated, high-conviction exposure to 10 companies positioned at the center of memory semiconductor innovation.
- Not a Single-Stock Bet: Gain exposure across multiple companies rather than relying on a single company outcome.
- More of the Theme; Less of the Noise: A concentrated portfolio may help reduce exposure to peripheral holdings that are less central to the opportunity.
Objective & Strategy
The Amplify Top 10™ Asia Memory ETF (AHBM) focuses on market leaders across the memory semiconductor value chain—from DRAM (dynamic random-access memory), NAND (‘Not And’ flash memory), and HBM (High-Bandwidth Memory) to the equipment, materials, packaging, and testing technologies that support advanced memory production. AHBM seeks to provide investment results (before fees and expenses) that generally correlate to the total return performance of the Akros Asia Memory Semiconductor Top 10 Index.

Key Information
Fund Details
| Ticker | AHBM |
| Launch Date | 08/19/2026 |
| Primary Exchange | NYSE Arca |
| CUSIP | 032108276 |
| Net Assets | $6,238,019 |
| Shares Outstanding | 300,000 |
| Holdings Exposure (view all holdings) | 10 |
| Total Expense Ratio i | 0.59% |
Index Details
| Index Name | Akros Asia Memory Semiconductor Top 10 Index |
| Index Ticker | AHBM |
| Index Provider | Akros Technologies, Inc |
| Rebalance Frequency | Quarterly |
| Index Website | Akrostec.com |
Performance & Holdings
Performance
| Cumulative (%) | Annualized (%) | |||||||||
|---|---|---|---|---|---|---|---|---|---|---|
| 1MO | 3MO | 6MO | YTD | Since Inception | 1YR | 3YR | 5YR | 10YR | Since Inception | |
| NAV | 3.93% | — | — | — | 2.83% | — | — | — | — | — |
| Closing Price | 3.08% | — | — | — | 2.41% | — | — | — | — | — |
| Akros Asia Memory Semiconductor Top 10 Index TR | 4.08% | — | — | — | 4.76% | — | — | — | — | — |
| Cumulative (%) | Annualized (%) | |||||||||
|---|---|---|---|---|---|---|---|---|---|---|
| 1MO | 3MO | 6MO | YTD | Since Inception | 1YR | 3YR | 5YR | 10YR | Since Inception | |
| NAV | 3.93% | — | — | — | 2.83% | — | — | — | — | — |
| Closing Price | 3.08% | — | — | — | 2.41% | — | — | — | — | — |
| Akros Asia Memory Semiconductor Top 10 Index TR | 4.08% | — | — | — | 4.76% | — | — | — | — | — |
The performance data quoted represents past performance and does not guarantee future results. Investment return and principal value of an investment will fluctuate so that an investor’s shares, when sold or redeemed, may be worth more or less than the original cost. Current performance may be lower or higher than the performance quoted. Brokerage commissions will reduce returns. NAV is the sum of all its assets less any liabilities, divided by the number of shares outstanding. The closing price is the last price at which the fund traded.
Indexes are unmanaged and it’s not possible to invest directly in an index. Akros Asia Memory Semiconductor Top 10 Index seeks to provide investment exposure to 10 equity securities issued by memory semiconductor companies based in Asian markets.
Top 10™ Holdings Exposure
Fund holdings are subject to change at any time and should not be considered recommendations to buy or sell any security. Weighting reflects stock position and/or position held via total return swaps.
Allocation
| Industry Allocation | Weight (%) |
|---|---|
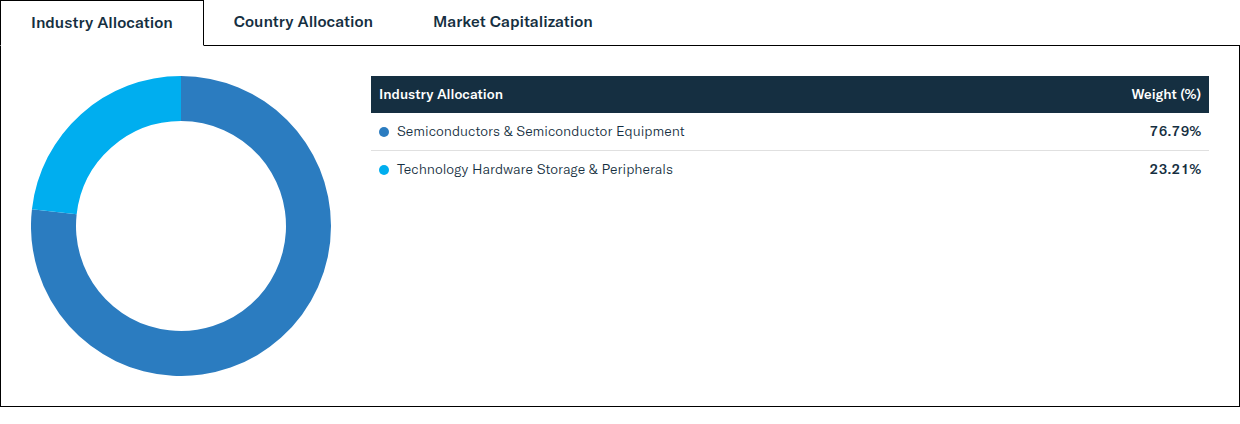
| Semiconductors & Semiconductor Equipment | 76.79% |
| Technology Hardware Storage & Peripherals | 23.21% |
| Market Capitalization | Weight (%) |
|---|---|
| Large Capitalization (> $10B) | 91.14% |
| Mid Capitalization ($2B - $10B) | 8.86% |
| Small Capitalization ($300M - < $2B) | 0.00% |
| Country Allocation | Weight (%) |
|---|---|
| Korea | 48.35% |
| Taiwan | 23.68% |
| Japan | 18.74% |
| China | 9.23% |
Distributions
| Ex-Date | Record Date | Payable Date | Amount (USD) |
|---|---|---|---|
| 12/30/2026 | 12/30/2026 | 12/31/2026 | — |
There is no guarantee that distributions will be made.
Price
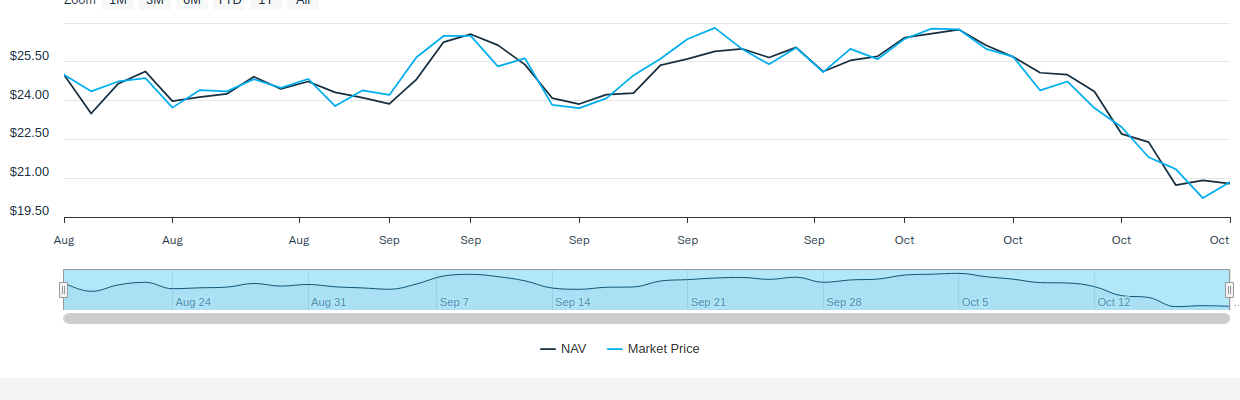
NAV/Market Price
| Previous Day's NAV | |
|---|---|
| Net Asset Value: | $20.79 |
| Daily Change: | $-0.12 |
| % Daily Change: | -0.59% |
| 30-Day Median Bid/Ask Spread: | 0.42% |
| Previous Day's Market Price | |
|---|---|
| Closing Price: | $20.85 |
| Daily Change: | $0.62 |
| % Daily Change: | 3.07% |
| % Premium/Discount: | 0.28% |
Daily Price/NAV Performance
Premium/Discount
| 2025 | Q1 2026 | Q2 2026 | Q3 2026 | Q4 2026 | |
|---|---|---|---|---|---|
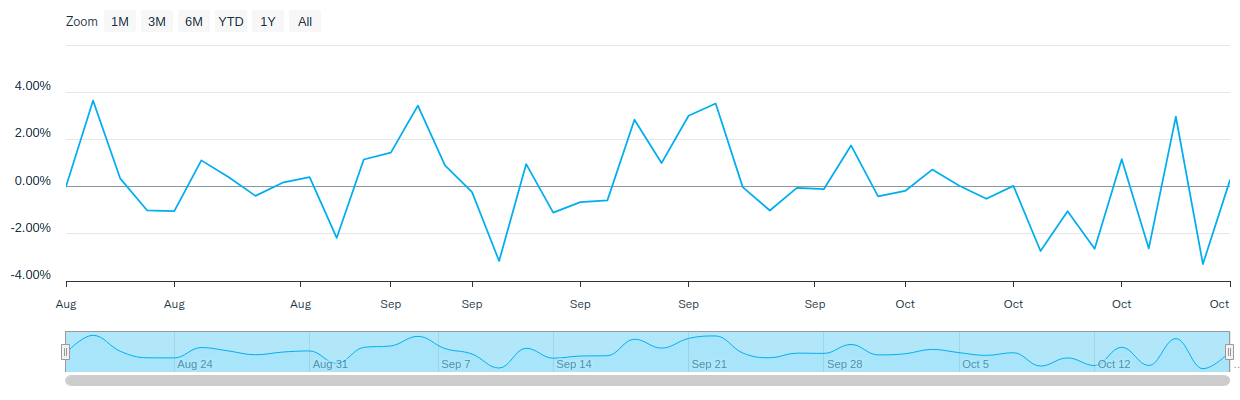
| Days Traded at Premium | - | - | - | 16 | - |
| Days Traded at NAV | - | - | - | 1 | - |
| Days Traded at Discount | - | - | - | 14 | - |
The table and line graph are provided to show the frequency at which the closing price of the Fund was at a premium (above) or discount (below) to the Fund’s daily net asset value (“NAV”). The table and line graph represent past performance and cannot be used to predict future results. Shareholders may pay more than NAV when buying Fund shares and receive less than an NAV when those shares are sold because shares are bought and sold at current market prices.
Literature
Fund Resources
Regulatory Resources
Insights
Memory Semiconductors: The AI Bottleneck Hiding in Plain Sight
September 14, 2026
How rising memory requirements and Asia’s global leadership are creating a distinct investment opportunity.
BNAV Commentary 3Q 2026
October 16, 2026
Bitcoin: a technical take, divergence from Tech, and year-end tax considerations.
International Insights: Investing Across the Globe - September 2026
October 13, 2026
Audio Commentary by Tim Seymour, IDVO Portfolio Manager
How to Invest
Amplify ETFs trade throughout the day, similar to publicly-traded stocks, on an exchange. There are multiple ways to invest in Amplify ETFs:
- Contact a Financial Advisor to discover how Amplify ETFs may fit within your portfolio.
- Amplify ETFs are available through various online platforms and brokerage accounts.
Connect with your ETF Specialist or call (855) 267-3837
Investing involves risk, including possible loss of principal. There can be no assurance that the Fund’s investment objective will be achieved. The Fund is newly formed and has a limited history of operations. ETF shares are bought and sold at market price and may trade at a premium or discount to NAV. Brokerage commissions will reduce returns. The Fund follows a passive, index based investment approach and is subject to index tracking error, and non-correlation risks. The Fund is non-diversified, invests in a limited number of issuers, and may be more volatile than diversified funds. Companies in the memory semiconductor industry may be affected by technological change, competition, intellectual property risks, supply chain disruptions, pricing pressure, regulatory developments, and evolving market demand, which may result in increased volatility. The Fund invests primarily in Asian companies and is subject to risks including economic and political developments, trade disputes, government intervention, currency fluctuations, market concentration, and regional geopolitical tensions, which may adversely affect Fund performance. The use of derivatives and swap agreements may increase volatility.
Investment Adviser: Amplify Investments LLC; Sub-Adviser: Samsung Asset Management.